. 2011 Nov 6;12(12):1230-7.
doi: 10.1038/ni.2153.

Repression of the DNA-binding inhibitor Id3 by Blimp-1 limits the formation of memory CD8+ T cells

Affiliations

Repression of the DNA-binding inhibitor Id3 by Blimp-1 limits the formation of memory CD8+ T cells

Yun Ji et al. Nat Immunol. .

Abstract

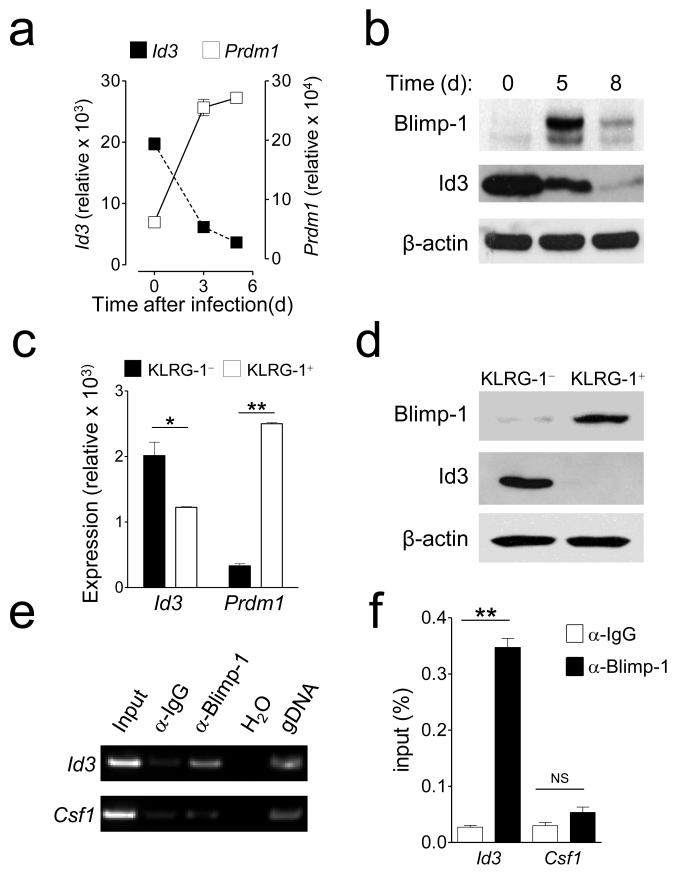
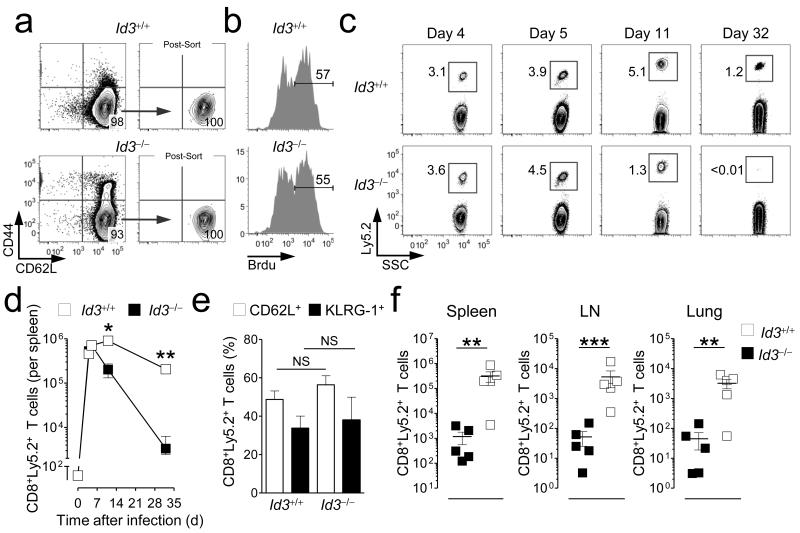
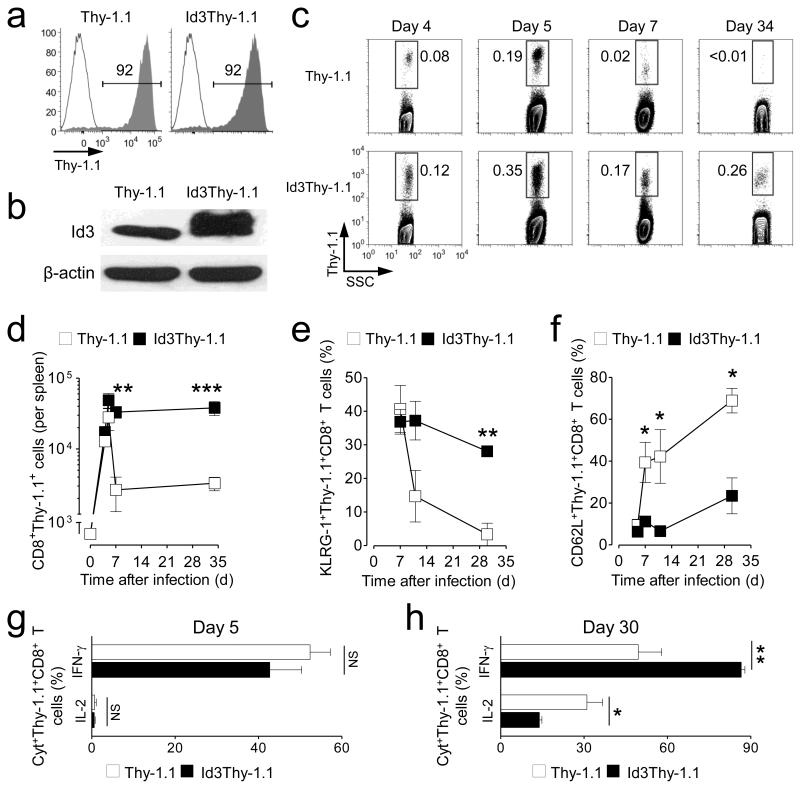
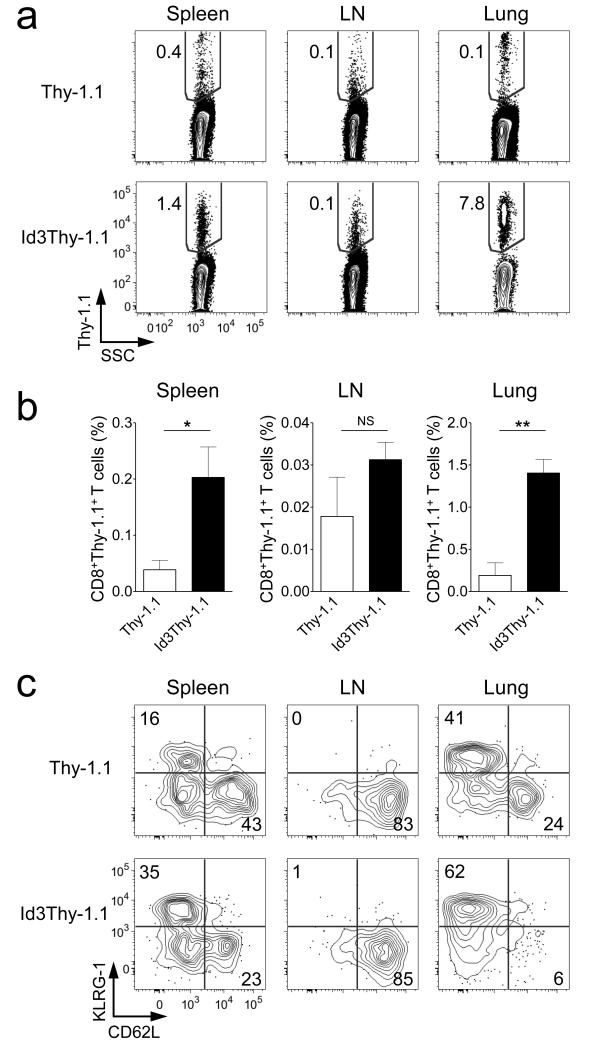
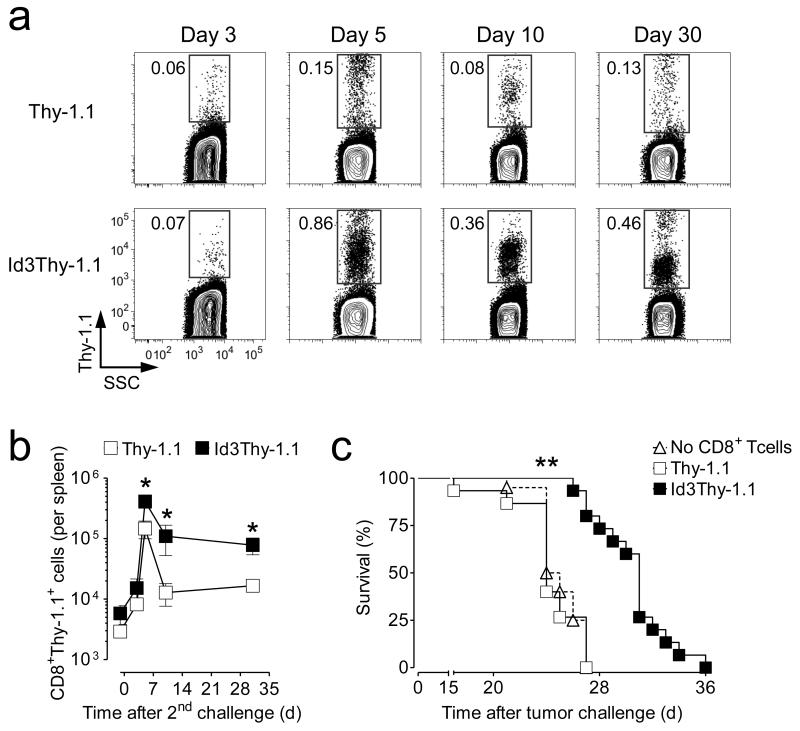
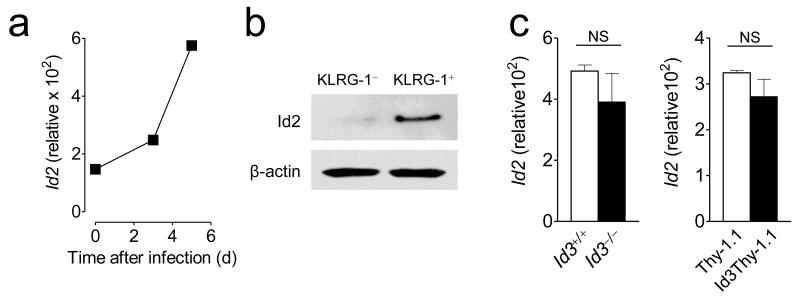
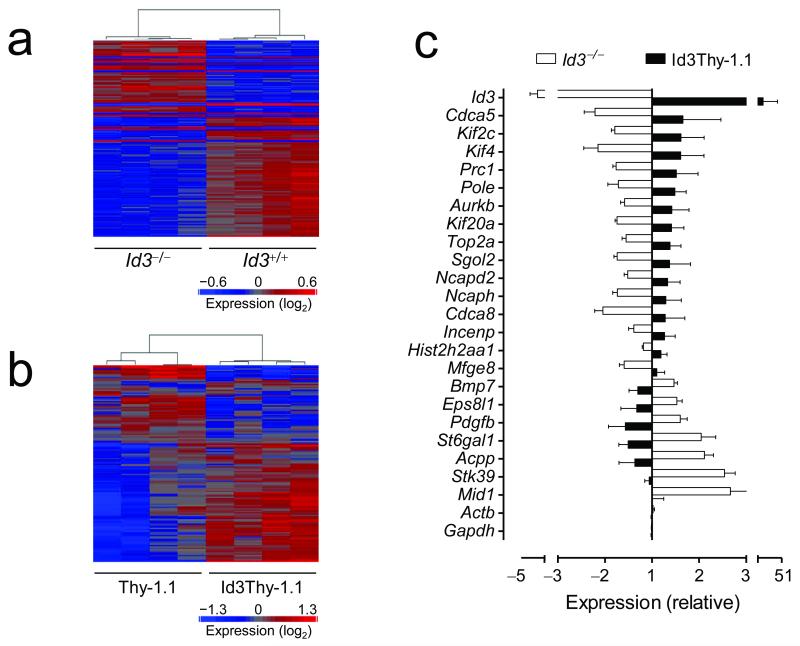
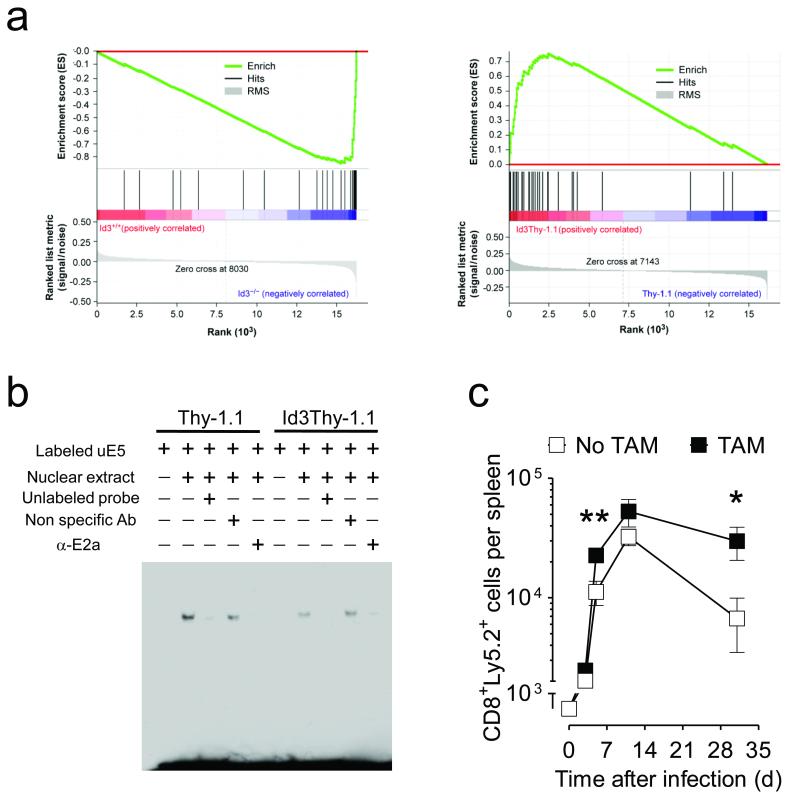
The transcriptional repressor Blimp-1 promotes the differentiation of CD8(+) T cells into short-lived effector cells (SLECs) that express the lectin-like receptor KLRG-1, but how it operates remains poorly defined. Here we show that Blimp-1 bound to and repressed the promoter of the gene encoding the DNA-binding inhibitor Id3 in SLECs. Repression of Id3 by Blimp-1 was dispensable for SLEC development but limited the ability of SLECs to persist as memory cells. Enforced expression of Id3 was sufficient to restore SLEC survival and enhanced recall responses. Id3 function was mediated in part through inhibition of the transcriptional activity of E2A and induction of genes regulating genome stability. Our findings identify the Blimp-1-Id3-E2A axis as a key molecular switch that determines whether effector CD8(+) T cells are programmed to die or enter the memory pool.


Figures

Figure 1
Figure 1. Blimp-1 binds the Id3 promoter and represses its expression in effector CD8+ T cells
(a) mRNA expression levels of Prdm1 and Id3 in naïve or adoptive transferred pmel-1 CD8+ T cells at indicated time-points after gp100-vaccinia virus infection. Values are obtained with qRT-PCR and normalized to Actb mRNA levels. (b) Protein expression levels of Blimp-1 and Id3 of naïve and activated CD8+ T cells at indicated time-points after stimulation with anti-CD3, anti-CD28 and IL-2. (c) Relative expression levels of Prdm1 and Id3 in KLRG-1+ and KLRG-1 pmel-1 CD8+ T cells 5 days after infection. Values are obtained with qRT-PCR and normalized to Actb mRNA levels. (d) Protein expression levels of Blimp-1 and Id3 in KLRG-1+ and KLRG-1 pmel-1 CD8+ T cells 5 days after infection. (e) Amplification of Id3 and Csf1 promoter region from anti-Blimp-1 antibody immunoprecipitated chromatin samples. Input DNA was amplified with the same primers as a control for the equivalence of the starting material. Anti-IgG antibody was used as a non-specific control. (f) Amplification of Id3 promoter region from either anti-IgG or anti-Blimp-1 antibody immunoprecipitated chromatin samples measured by quantitative ChIP-PCR. Csf1 was used as a non-specific control. Data are representative of 2 (a, c-f) or 4 (b) independent experiments (error bars (a, c, f), s.e.m. of 3 samples). * = P < 0.05; ** = P < 0.001.
Figure 2
Figure 2. Id3 is essential for the generation of CD8+ memory T cells
(a) Representative flow cytometry analysis of pmel-1 Rag1−/− Id3+/+ CD8+ T cell and pmel-1 Rag1−/− Id3−/− CD8+ T cells before and after sorting CD62L+CD44 naïve CD8+ T cells. Contour plots are shown after gating on CD8+ cells. (b) Representative flow cytometry analysis of BrdU+ incorporation 4 days following adoptive transfer of Id3+/+ or Id3−/− pmel-1 Rag1−/−CD8+ T cells in conjunction with gp100-VV infection. Infected mice received 1.5 mg BrdU 16 hours before analysis of splenocytes. (c,d) Representative flow cytometry analysis (c) and numbers (d) of Ly5.2+ CD8+ pmel-1 T cells following adoptive transfer of 6 × 10³ Id3+/+ or Id3−/− pmel-1 Rag1−/−CD8+ T cell at indicated time-points after gp100-VV infection. Contour plots show Ly5.2+ T cells after gating on CD8+ cells. (e) Percentage of CD62L+ and KLRG-1+ pmel-1 Rag1−/−CD8+ T cells in Id3−/− or Id3+/+ groups 6 days after transferring Id3+/+ or Id3−/− pmel-1 Rag1−/−CD8+ T cells in conjunction with gp100-VV infection. (f) Numbers of CD8+ Ly5.2+ pmel-1 T cells in the spleen, lymph node, and lung following adoptive transfer of 4 × 10⁴ Id3+/+ or Id3−/− pmel-1 Rag1−/− CD8+ T cell at day 30 after gp100-VV infection. Data are representative of 2 independent experiments (error bars (d, e), s.e.m. of 3-4 samples). * = P < 0.05; ** = P < 0.01; *** = P < 0.001.
Figure 3
Figure 3. Enforced expression of Id3 promotes long-term survival of KLRG-1+ effector T cells
(a) Percentage of Thy-1.1 positive cells in pmel-1 CD8+ T cells transduced with retrovirus expressing Id3 and Thy-1.1 (Id3Thy-1.1) or Thy-1.1 alone. (b) Id3 protein expression levels in Id3Thy-1.1 or Thy-1.1 pmel-1 CD8+ T cells by anti-Id3 immunoblotting. (c) Representative flow cytometry analysis of splenic T cells following adoptive transfer of 6 × 10² Id3Thy-1.1 or Thy-1.1 pmel-1 CD8+ T cells at indicated time-points post gp100-VV infection. Contour plots show Thy-1.1+ T cells after gating on CD8+ cells. (d-f) Numbers of (d), percentage of KLRG-1+(e) and percentage of CD62L+ (f) pmel-1 Thy-1.1+ CD8+ T cells in the spleen following adoptive transfer of Id3Thy-1.1 or Thy-1.1 pmel-1 CD8+ T cells in conjunction with gp100-VV infection. (g,h) Percentage of pmel-1 Thy-1.1+ CD8+ T cells producing IFN-γ and IL-2 after stimulation with leukocyte activation cocktail at day 5 (g) and day 30 (h) post infection. Data are representative of 2 (g, h), 3 (b, e, f), or 5 (a, c, d) independent experiments (error bars (d-h), s.e.m. of 3-4 samples). * = P < 0.05; ** = P < 0.01; *** = P < 0.001.
Figure 4
Figure 4. CD8+ T cells overexpressing Id3 are enriched in peripheral tissues
(a) Representative flow cytometry analysis of T cells from spleen, lymph node, and lung following adoptive transfer of 3 × 10⁵ Id3Thy-1.1 or Thy-1.1 pmel-1 CD8+ T cells 40 days post gp100-VV infection. Contour plots show Thy-1.1+ T cells after gating on CD8+ cells. (b) Percentage of pmel-1 CD8+ Thy-1.1+ T cells in the spleen, lymph node, and lung as described in a. (c) Representative flow cytometry analysis of pmel-1 CD8+ Thy-1.1+ T cells from spleen, lymph node, and lung. Contour plots show KLRG-1 and CD62L expression after gating on CD8+ Thy-1.1+ cells. Data are representative of 2 independent experiments (error bars (b), s.e.m. of 3 samples). * = P < 0.05; ** = P < 0.01.
Figure 5
Figure 5. CD8+ T cells overexpressing Id3 mediated enhanced secondary responses
(a) Representative flow cytometry analysis of splenic T cells following adoptive transfer of 6 × 10² Id3Thy-1.1 or Thy-1.1 pmel-1 CD8+ T cells together with gp100 vaccinia virus and rechallenged with gp100 fowlpox virus 30 days after the primary infection. Contour plots show Thy-1.1+ T cells after gating on CD8+ cells. (b) Numbers of pmel-1 Thy-1.1+ CD8+ T cells in the spleen following secondary gp100-viral challenge as described in a. (c) Survival of WT mice challenged with 105 B16 melanoma cells 30 days after gp100-VV infection with or without adoptive transfer of Id3Thy-1.1 or Thy-1.1 pmel-1 CD8+ T cells. Data are representative (a, b) or pooled (c) of 2 independent experiments (error bars (b, c), s.e.m. of 3-7 samples).* = P < 0.05; ** = P < 0.001.
Figure 6
Figure 6. Id3 does not affect Id2 expression in effector CD8+ T cells
(a) mRNA expression levels of Id2 in naïve or adoptively transferred pmel-1 CD8+ T cells at indicated time-points after gp100-VV infection. (b) Protein expression levels of Id2 in KLRG-1+ and KLRG-1 pmel-1 CD8+ T cells 5 days after infection. (c) mRNA expression levels of Id2 in adoptively transferred Id3+/+ and Id3−/− (left panel) or Id3Thy-1.1 and Thy-1.1 (right panel) pmel-1 CD8+ T cells 5 days after gp100-VV infection. Values are obtained with qRT-PCR and normalized to Actb mRNA levels. Data are representative of 2 independent experiments (error bars (a, c), s.e.m. of triplicates).
Figure 7
Figure 7. Id3 modulates the expression of genes involved in DNA replication and repair
(a,b) Heat maps of differentially expressed genes (>1.3 fold change in expression and false discovery rate P < 0.05) between Id3+/+ and Id3−/− (a) or Id3Thy-1.1 and Thy-1.1 pmel-1 CD8+ T cells (b) sorted 5 days after gp100-VV infection. Data represent 2 separate experiments (upper and lower panels) in which groups were analyzed in biological quadruplicates. (c) Fold changes of genes involved in DNA replication and repair network differentially expressed in Id3−/− and Id3Thy-1.1 relative to controls.
Figure 8
Figure 8. Deletion of E2a increases CD8+ memory T cell formation
(a) Gene Set Enrichment Analysis (GSEA) of overexpressed genes in pre-B-cell lines deficient of Tcf3 compared to transcriptomes of Id3−/− and Id3+/+ (left panel) or Id3Thy-1.1 and Thy-1.1 pmel-1 CD8+ T cells (right panel) sorted 5 days after gp100-VV infection. Data represent 2 separate experiments (left and right panels) in which groups were analyzed in biological quadruplicates. (b) Electrophoretic mobility shift assay of nuclear extract from Id3Thy-1.1 or Thy-1.1 pmel-1 CD8+ T cells using biotin-labeled oligonucleotide probes containing the E-box binding sites. Unlabeled oligonucleotide probes were used as competitors. Anti-E2a antibody and non-specific antibody were used to determine the specificity of shifted bands. (c) Numbers of pmel-1 Ly5.2+ CD8+ T cells in the spleen following adoptive transfer of 6 × 10³ pmel-1 Tcf3flox/flox Cre-ERT2 CD8+ T cells previously activated in vitro for 5 days with or without tamoxifen to delete Tcf3. Data are representative of 6 (b) and 2 (c) independent experiments (error bars (c), s.e.m. of 3 or 4 samples). * = P < 0.05.

References

    1. Turner CA, Jr., Mack DH, Davis MM. Blimp-1, a novel zinc finger-containing protein that can drive the maturation of B lymphocytes into immunoglobulin-secreting cells. Cell. 1994;77:297–306. - PubMed
    1. Crotty S, Johnston RJ, Schoenberger SP. Effectors and memories: Bcl-6 and Blimp-1 in T and B lymphocyte differentiation. Nat. Immunol. 2010;11:114–120. - PMC - PubMed
    1. Magnusdottir E, et al. Epidermal terminal differentiation depends on B lymphocyte- induced maturation protein-1. Proc. Natl. Acad. Sci. U. S. A. 2007;104:14988–14993. - PMC - PubMed
    1. Nishikawa K, et al. Blimp1-mediated repression of negative regulators is required for osteoclast differentiation. Proc. Natl. Acad. Sci. U. S. A. 2010;107:3117–3122. - PMC - PubMed
    1. Shin H, et al. A role for the transcriptional repressor Blimp-1 in CD8(+) T cell exhaustion during chronic viral infection. Immunity. 2009;31:309–320. - PMC - PubMed

Publication types

MeSH terms

Substances

Associated data