. 2011 Nov 6;17(12):1674-9.
doi: 10.1038/nm.2543.

Identification of a central role for complement in osteoarthritis

Affiliations

Identification of a central role for complement in osteoarthritis

Qian Wang et al. Nat Med. .

Abstract

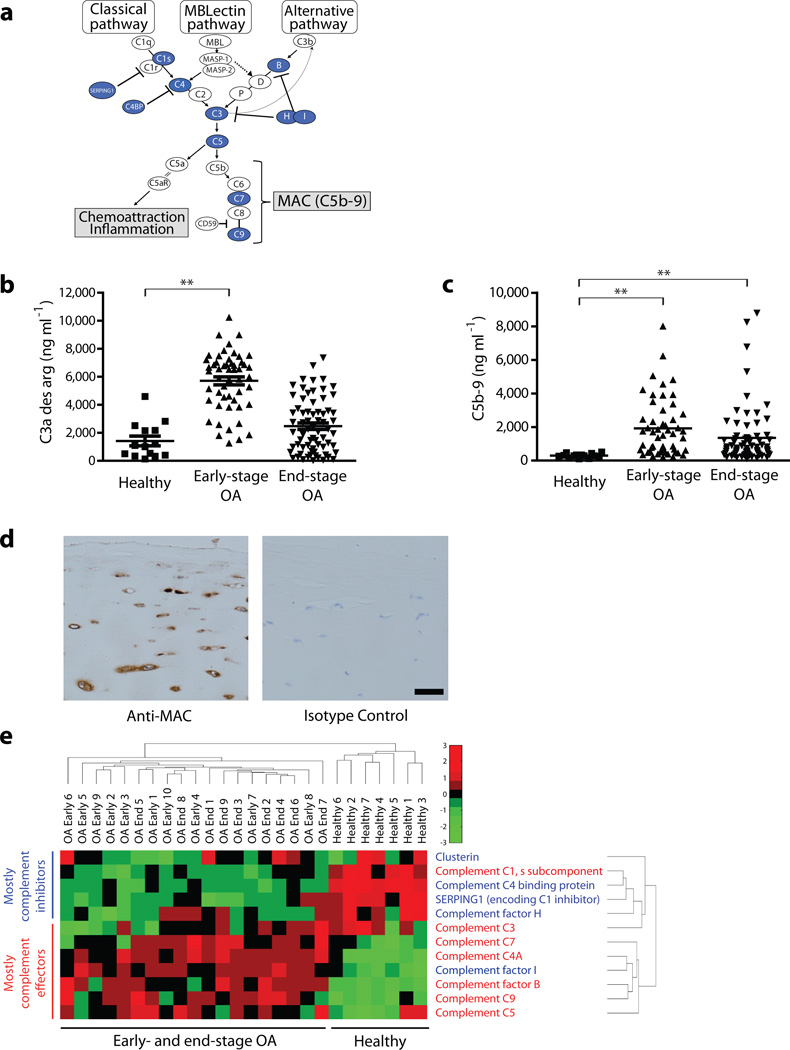
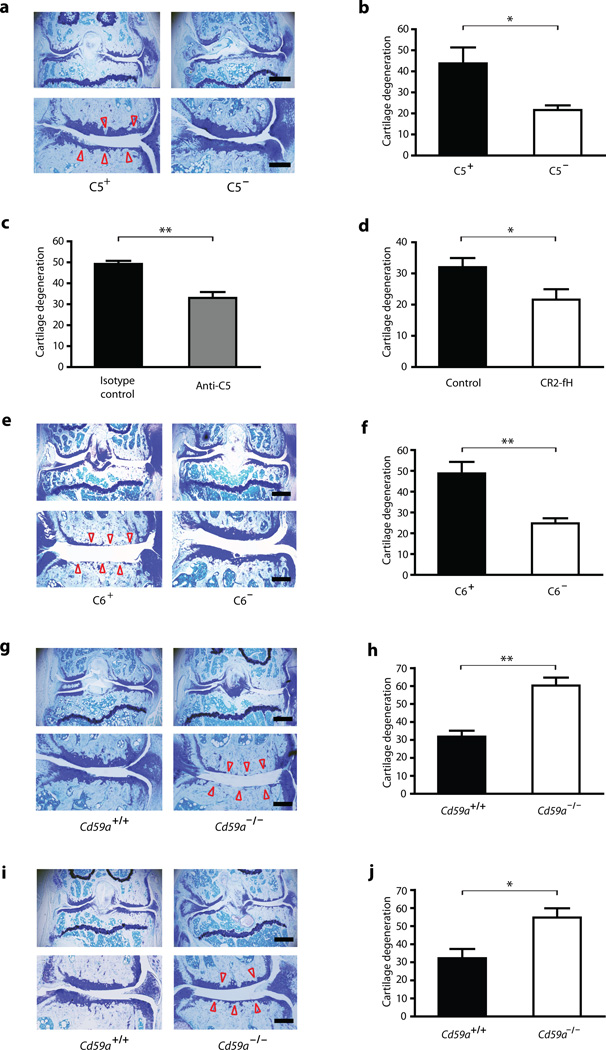
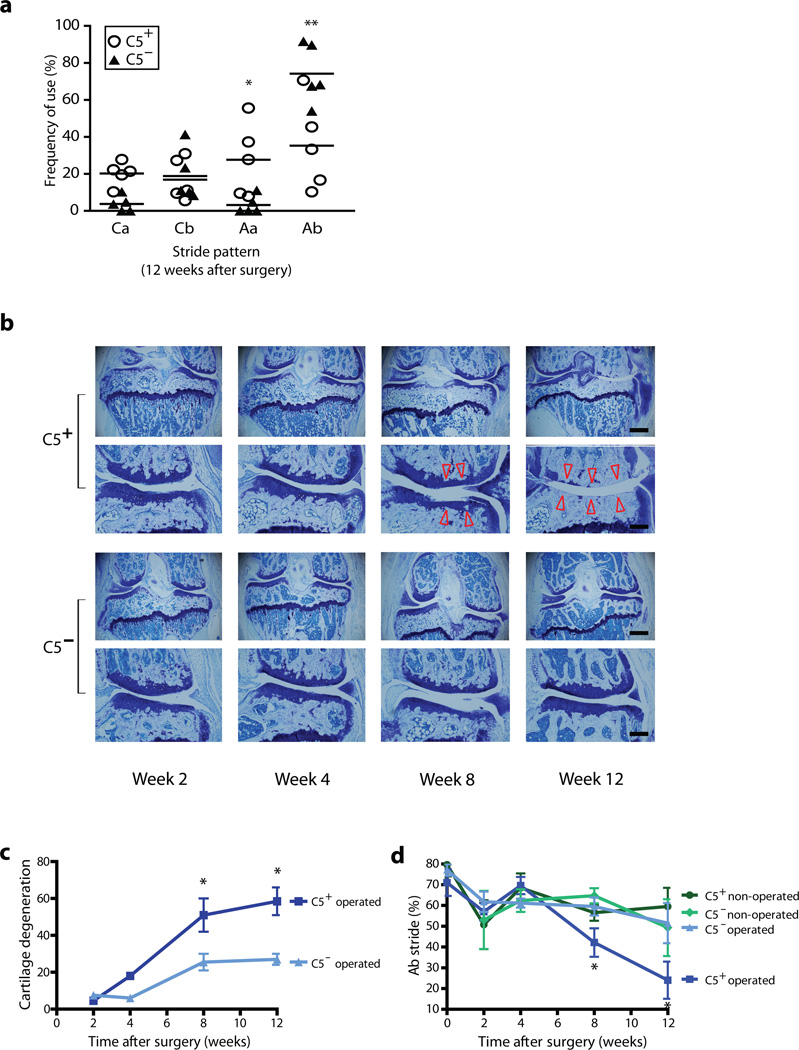
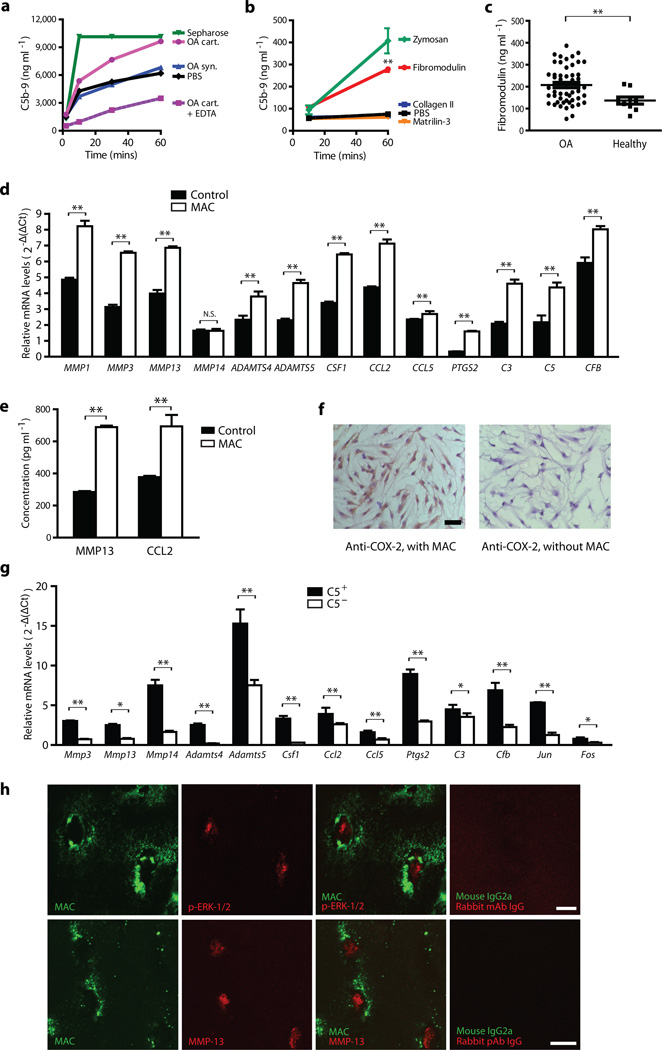
Osteoarthritis, characterized by the breakdown of articular cartilage in synovial joints, has long been viewed as the result of 'wear and tear'. Although low-grade inflammation is detected in osteoarthritis, its role is unclear. Here we identify a central role for the inflammatory complement system in the pathogenesis of osteoarthritis. Through proteomic and transcriptomic analyses of synovial fluids and membranes from individuals with osteoarthritis, we find that expression and activation of complement is abnormally high in human osteoarthritic joints. Using mice genetically deficient in complement component 5 (C5), C6 or the complement regulatory protein CD59a, we show that complement, specifically, the membrane attack complex (MAC)-mediated arm of complement, is crucial to the development of arthritis in three different mouse models of osteoarthritis. Pharmacological modulation of complement in wild-type mice confirmed the results obtained with genetically deficient mice. Expression of inflammatory and degradative molecules was lower in chondrocytes from destabilized joints from C5-deficient mice than C5-sufficient mice, and MAC induced production of these molecules in cultured chondrocytes. Further, MAC colocalized with matrix metalloprotease 13 (MMP13) and with activated extracellular signal-regulated kinase (ERK) around chondrocytes in human osteoarthritic cartilage. Our findings indicate that dysregulation of complement in synovial joints has a key role in the pathogenesis of osteoarthritis.


Figures

Figure 1
Figure 1
Complement components are aberrantly expressed and activated in human osteoarthritic joints. (a) Schematic of the complement cascade; blue-filled circles denote the complement effectors and inhibitors identified as aberrantly expressed in osteoarthritic synovial fluid. (b,c) ELISA quantification of (b) C3a des arg and of (c) the soluble form of MAC (complement effectors C5b-9) in synovial fluids from healthy individuals (n = 14) and from individuals with early-stage osteoarthritis (n = 52) or end-stage osteoarthritis (n = 69). **P ≤ 0.01 by one-way ANOVA and Dunnett’s post-hoc test. (d) Immunohistochemical staining of MAC in cartilage from individuals with end-stage osteoarthritis. Isotype-matched antibodies were used as negative controls. Staining is representative of that seen in samples from 4 different individuals with osteoarthritis. Scale bar, 100 µm. (e) Cluster analysis of gene-expression profiles in microarray datasets from synovial membranes from healthy individuals (downloaded from the NCBI Gene Expression Omnibus) and from individuals with early-stage or end-stage osteoarthritis (experimentally determined). Analysis was limited to the set of genes encoding the complement-related proteins differentially expressed in RA compared to healthy synovial fluid (Supplementary Table 1). The scale bar represents fold change in gene expression compared to the reference control. Complement effectors are shown in red text, and complement inhibitors in blue text.
Figure 2
Figure 2
The complement cascade, acting through its MAC effector arm, is crucial for the development of osteoarthritis in three different mouse models. (a,e,g,i) Toluidine-blue-stained sections of the medial region of mouse stifle joints. (a) Representative cartilage degeneration in C5+ and C5 mice subjected to medial meniscectomy. (b) Quantification of cartilage degeneration in (a) (n = 5 mice per group). (c) Quantification of cartilage degeneration in wild-type mice subjected to medial meniscectomy and then treated i.p. with 750 µg of either the C5-specific monoclonal antibody BB5.1 or an isotype-control antibody (n = 5 mice per group). (d) Quantification of cartilage degeneration in wild-type mice subjected to medial meniscectomy and then treated i.v. with 250 µg of CR2-fH or with PBS (n = 5 mice per group). (e) Representative cartilage degeneration in C6+ and C6 mice subjected to medial meniscectomy. (f) Quantification of cartilage degeneration in (e) (n = 13 mice per group). (g) Representative cartilage degeneration in Cd59a+/+ and Cd59a−/− mice subjected to medial meniscectomy. (h) Quantification of cartilage degeneration in (g) (n = 10 mice per group). (i) Representative cartilage degeneration in Cd59a+/+ and Cd59a−/− mice subjected to DMM. (j) Quantification of cartilage degeneration in (i) (n = 5 mice per group). Arrowheads indicate areas of cartilage degeneration. Scale bars: low-magnification (uppermost) images, 500 µm; higher-magnification (lower) images, 200 µm. Bar-chart data are the mean + s.e.m. *P < 0.05, **P < 0.01, by t test.
Figure 3
Figure 3
C5 deficiency protects against the progressive development of osteoarthritic joint pathology and gait dysfunction. (a) Gait analysis of C5+ and C5 mice 12 weeks after medial meniscectomy (n = 5 mice per group). C5 mice used the Ab stride pattern (the sequence of paw strides being right front—right hind—left front—left hind) with normal frequency, whereas C5+ mice used this pattern significantly less frequently. *P < 0.05, **P < 0.01 by t test. Results are representative of two independent experiments. (b) Histological analysis of articular cartilage at serial time points after medial meniscectomy. Representative toluidine-blue-stained sections of the medial region of stifle joints are presented; arrowheads show areas of cartilage degeneration. Scale bars: low-magnification (upper) images, 500 µm; high-magnification (lower) images, 200 µm. (c) Quantification of cartilage degeneration in C5+ and C5 mice subjected to medial meniscectomy (C5+ operated and C5 operated). *P ≤ 0.05 by t test comparing C5+ operated and C5 operated. Data are the mean ± s.e.m. (d) Gait analysis of C5+ operated and C5 operated mice, and of C5+ non-operated and C5 non-operated mice, at serial time points after medial meniscectomy. *P ≤ 0.05 by t test comparing C5+ operated mice and C5 operated mice. At week 8, n = 6 for C5+ operated, n = 6 for C5 operated; at week 12, n = 4 for C5+ operated, n = 4 for C5 operated; at all time points n ≥ 4 for C5+ non-operated and n = 3 for C5 non-operated.
Figure 4
Figure 4
Cartilage ECM components can induce MAC formation, and MAC induces chondrocyte expression of inflammatory and catabolic molecules. ELISA quantification of C5b-9 (soluble MAC) in (a) 67% human serum incubated with 20 µg ml−1 of pulverized human osteoarthritic cartilage (OA cart) or synovium (OA syn), or (b) 10% human serum incubated with 20 µg ml−1 of recombinant cartilage ECM components. Sepharose and zymosan are positive controls; PBS and EDTA negative controls. **P ≤ 0.01 by one-way ANOVA with Dunnett’s post-hoc test comparing each cartilage component with PBS. Data are the mean of triplicate values ± s.d. and representative of three independent experiments. (c) ELISA quantification of fibromodulin in synovial fluids from individuals with osteoarthritis (n = 50) and healthy individuals (n = 9). **P ≤ 0.01 by t test. (d–f) qPCR analysis of relative mRNA expression (d), ELISA analysis of protein expression (e), and immunocytochemical analysis of COX-2 expression (f) in human chondrocytes incubated with or without MAC for 72 hours. Scale bar, 50 µm. *P ≤ 0.05; **P ≤ 0.01 by t test. Data are the mean ± s.d. and representative of three independent experiments. (g) mRNA expression in chondrocytes from C5+ and C5 mice (n = 4 mice per group) subjected to DMM. Data are the mean + s.e.m. of triplicates and representative of results from 4 mice from 2 independent experiments. *P ≤ 0.05; **P ≤ 0.01 by fixed-effect ANOVA taking into account both destabilized and non-destabilized joints. (h) Immunofluorescent analysis of p-ERK1/2, MMP-13, and MAC co-localization in human osteoarthritic cartilage. Scale bar, 10 µm.

Comment in

References

    1. Felson DT. Clinical practice. Osteoarthritis of the knee. N Engl J Med. 2006;354:841–848. - PubMed
    1. Goldring MB, Goldring SR. Osteoarthritis. J Cell Physiol. 2007;213:626–634. - PubMed
    1. Pelletier JP, Martel-Pelletier J, Abramson SB. Osteoarthritis, an inflammatory disease: potential implication for the selection of new therapeutic targets. Arthritis Rheum. 2001;44:1237–1247. - PubMed
    1. Hill CL, et al. Synovitis detected on magnetic resonance imaging and its relation to pain and cartilage loss in knee osteoarthritis. Ann Rheum Dis. 2007;66:1599–1603. - PMC - PubMed
    1. Gobezie R, et al. High abundance synovial fluid proteome: distinct profiles in health and osteoarthritis. Arthritis Res Ther. 2007;9:R36. - PMC - PubMed

Publication types

MeSH terms

Associated data