. 2012 May;131(5):665-74.
doi: 10.1007/s00439-011-1111-9. Epub 2011 Nov 5.

Exploration of signals of positive selection derived from genotype-based human genome scans using re-sequencing data

Affiliations

Exploration of signals of positive selection derived from genotype-based human genome scans using re-sequencing data

Min Hu et al. Hum Genet. 2012 May.

Abstract

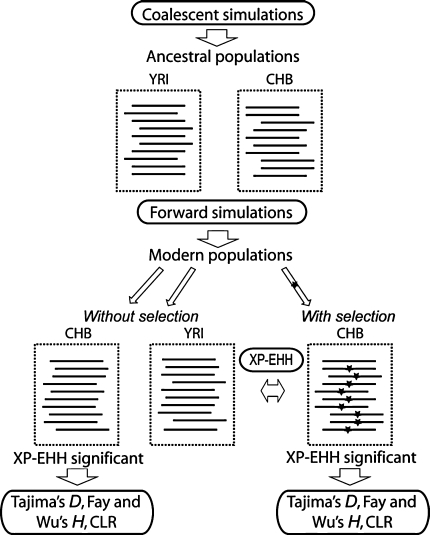
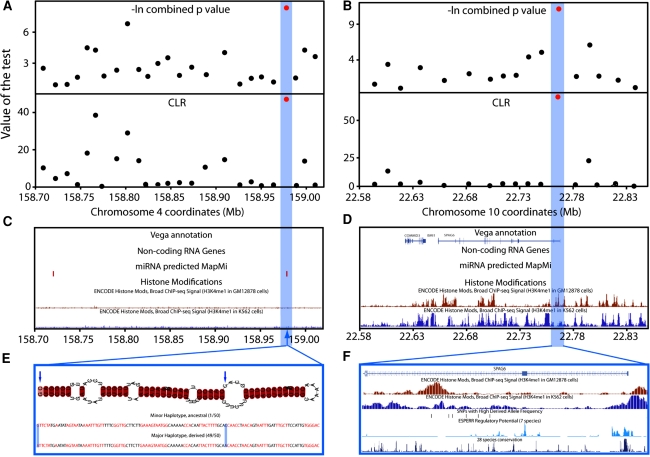
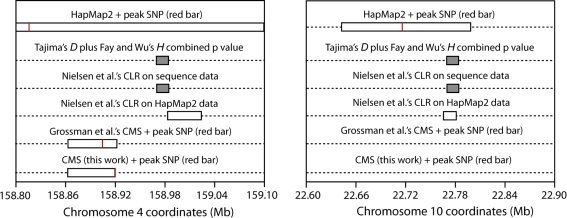
We have investigated whether regions of the genome showing signs of positive selection in scans based on haplotype structure also show evidence of positive selection when sequence-based tests are applied, whether the target of selection can be localized more precisely, and whether such extra evidence can lead to increased biological insights. We used two tools: simulations under neutrality or selection, and experimental investigation of two regions identified by the HapMap2 project as putatively selected in human populations. Simulations suggested that neutral and selected regions should be readily distinguished and that it should be possible to localize the selected variant to within 40 kb at least half of the time. Re-sequencing of two ~300 kb regions (chr4:158Mb and chr10:22Mb) lacking known targets of selection in HapMap CHB individuals provided strong evidence for positive selection within each and suggested the micro-RNA gene hsa-miR-548c as the best candidate target in one region, and changes in regulation of the sperm protein gene SPAG6 in the other.


Figures

Fig. 1
Fig. 1
Simulation design. Dotted boxes represent simulated haplotype samples; the star indicates the presence of a positively selected SNP. Arrows show the performance of the analyses described in the oval boxes
Fig. 2
Fig. 2
Simulation results. a Simulations were carried out under neutrality, and tests for selection [−ln combined p values for Tajima’s D and Fay and Wu’s H (top) or Nielsen et al.’s CLR (bottom)] were calculated in non-overlapping 10 kb windows across 300 kb. Values of the test were averaged over 16 independent neutral simulations that passed the XP-EHH filter. No departures from neutrality were seen. b 1,752 simulations with selection (selection coefficient 0.001, 0.004, 0.007, 0.01) that passed the XP-EHH filter and neutrality tests were averaged as in a. Departures from neutrality are seen most strongly in the window containing the selected SNP. c. The distribution of the top signal (lowest combined p value) or highest CLR in each simulation is shown across the 300-kb region. d. Probability that the known selected variant is found at each distance from the peak test value
Fig. 3
Fig. 3
Experimental results: localization of likely selection targets in the chr4 and chr10 regions. a. -log e of combined p values from Tajima’s D and Fay and Wu’s H (top) and Nielsen et al.’s CLR (bottom) calculated from re-sequencing data in windows corresponding to two or three PCR fragments (10–20 kb). The most significant statistics are shown in red, and fall into the same window at ~158.98 Mb (blue highlight). b Corresponding analysis of the chr10:22Mb region, where the most significant signals again fall into the same window, this time at ~22.78 Mb. c, d. Protein-coding genes from the Vega annotation, non-coding RNA and miRNA genes, and relevant ENCODE chromatin modifications in the two regions. e. Predicted miRNA in the chr4:158Mb target region. Two SNPs are present, including a G > A at the end of the miRNA carried on the major haplotype (49/50 chromosomes, selected in CHB) that may influence the strand forming the mature miRNA. f. H3K4me1 chromatin modifications indicating enhancer regions in GM12878 (second) and K562 (third) cells, SNPs with high derived allele frequencies (fourth), predicted regulatory potential (fifth) and 28 species conservation (bottom). Three high-frequency derived SNPs lie within candidate enhancers in one or other of the cell lines, but high-frequency derived SNPs do not lie within regions with high predicted regulatory potential or conservation
Fig. 4
Fig. 4
Localization of the signal of selection within the chr4 and chr10 regions using different approaches. The two starting regions are shown at the top (Sabeti et al. 2007), localizations using sequence data (gray bars) or HapMap2 genotype data (white bars) by this study in the middle, and the localization by the CMS statistic (Grossman et al. or this work) at the bottom

Similar articles

Cited by

References

    1. Akey JM. Constructing genomic maps of positive selection in humans: where do we go from here? Genome Res. 2009;19:711–722. doi: 10.1101/gr.086652.108. - DOI - PMC - PubMed
    1. Bustamante CD, et al. Natural selection on protein-coding genes in the human genome. Nature. 2005;437:1153–1157. doi: 10.1038/nature04240. - DOI - PubMed
    1. Cavalli-Sforza LL, Menozzi P, Piazza A. The history and geography of human genes. Princeton: Princeton University Press; 1994.
    1. Coop G, Bullaughey K, Luca F, Przeworski M. The timing of selection at the human FOXP2 gene. Mol Biol Evol. 2008;25:1257–1259. doi: 10.1093/molbev/msn091. - DOI - PMC - PubMed
    1. Enard W, et al. Molecular evolution of FOXP2, a gene involved in speech and language. Nature. 2002;418:869–872. doi: 10.1038/nature01025. - DOI - PubMed

Publication types

LinkOut - more resources