Comparative Study
. 2013 Feb;35(1):83-101.
doi: 10.1007/s11357-011-9333-2. Epub 2011 Nov 6.

Insulin receptor signaling mediates APP processing and β-amyloid accumulation without altering survival in a transgenic mouse model of Alzheimer's disease

Affiliations
Comparative Study

Insulin receptor signaling mediates APP processing and β-amyloid accumulation without altering survival in a transgenic mouse model of Alzheimer's disease

Oliver Stöhr et al. Age (Dordr). 2013 Feb.

Abstract

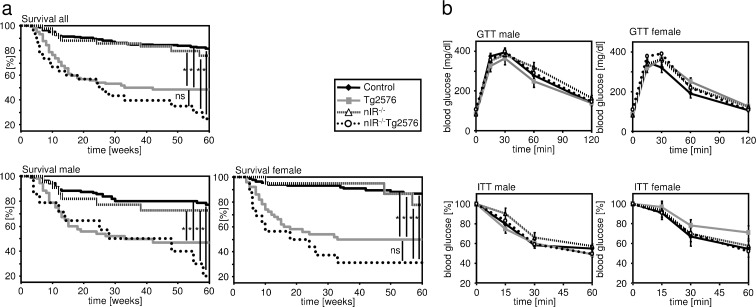
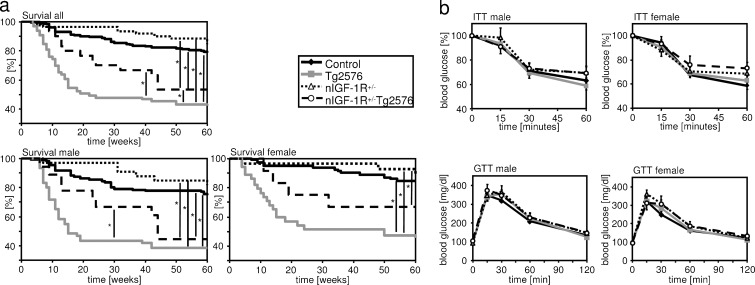
In brains from patients with Alzheimer's disease (AD), expression of insulin receptor (IR), insulin-like growth factor-1 receptor (IGF-1R), and insulin receptor substrate proteins is downregulated. A key step in the pathogenesis of AD is the accumulation of amyloid precursor protein (APP) cleavage products, β-amyloid (Aβ)(1-42) and Aβ(1-40). Recently, we and others have shown that central IGF-1 resistance reduces Aβ accumulation as well as Aβ toxicity and promotes survival. To define the role of IR in this context, we crossed neuron-specific IR knockout mice (nIR(-/-)) with Tg2576 mice, a well-established mouse model of an AD-like pathology. Here, we show that neuronal IR deficiency in Tg2576 (nIR(-/-)Tg2576) mice leads to markedly decreased Aβ burden but does not rescue premature mortality of Tg2576 mice. Analyzing APP C-terminal fragments (CTF) revealed decreased α-/β-CTFs in the brains of nIR(-/-)Tg2576 mice suggesting decreased APP processing. Cell based experiments showed that inhibition of the PI3-kinase pathway suppresses endosomal APP cleavage and decreases α- as well as β-secretase activity. Deletion of only one copy of the neuronal IGF-1R partially rescues the premature mortality of Tg2576 mice without altering total amyloid load. Analysis of Tg2576 mice expressing either a dominant negative or constitutively active form of forkhead box-O (FoxO)1 did not reveal any alteration of amyloid burden, APP processing and did not rescue premature mortality in these mice. Thus, our findings identified IR signaling as a potent regulator of Aβ accumulation in vivo. But exclusively decreased IGF-1R expression reduces AD-associated mortality independent of β-amyloid accumulation and FoxO1-mediated transcription.


Figures

Fig. 1
Fig. 1
Kaplan–Meier analysis and metabolic characterization of nIR−/−Tg2576 mice and respective controls up to 60 weeks of age. a Kaplan–Meier analysis. Survival was assessed from 172 female (86 wild type, 50 Tg2576, 20 nIR−/−, and 16 nIR−/−Tg2576) and 193 male mice (105 wild type, 52 Tg2576, 22 nIR−/−, and 14 nIR−/−Tg2576). *p < 0.05 (Wilcoxon rank test). b Glucose tolerance tests (GTT) of mice aged 10–11 weeks. GTT was assessed from 88 female (45 wild type, 15 Tg2576, 19 nIR−/−, and 9 nIR−/−Tg2576) and 100 male mice (50 wild type, 22 Tg2576, 19 nIR−/−, and 9 nIR−/−Tg2576). Insulin tolerance tests (ITT) of mice aged 10–11 weeks. ITT was assessed from 85 female (43 wild type, 14 Tg2576, 19 nIR−/−, and 9 nIR−/−Tg2576) and 103 male mice (51 wild type, 25 Tg2576, 18 nIR−/−, and 9 nIR−/−Tg2576)
Fig. 2
Fig. 2
Amyloid metabolism of nIR−/−Tg2576 and respective control mice aged 60 weeks. a Western blot analysis of insulin receptor β (IRβ), amyloid precursor protein (APP), Aβ, αCTF, βCTF, and RasGAP. b Quantitative analysis of APP expression in hippocampi. n = 6 per group. c ELISA of β-amyloid1–40/1–42 peptides from Aβ-guanindine-HCl extractions of hippocampi. n = 4–6 per group. Data represent means±SEM, *p < 0.05 (Student’s t test). d Western blot analysis of Aβ oligomers typical example of three independent experiments. e Dot blot analysis of the TBS-soluble fraction of hippocampal lysates (10-μg total protein per dot) from Tg2576 and nIR−/−Tg2576 using the oligomer specific antibody A11. The figure shows typical results from the same membran. n = 3 independent experiments. f Western blot analysis of BACE-1, Akt, pAktser473, Erk-1-/2 and pErk-1/-2Thr202/Tyr204, and actin
Fig. 3
Fig. 3
PI3K inhibition and APP C-terminal fragment formation in endosomes. a Western blot analysis of SHSY5Y wild-type and siIRS-2 cells using anti-IRS-2 antibodies. b Western blot analysis of APP CTFs from membrane fractions separated via sucrose gradient density centrifugation of wild-type, siIRS-2, and LY294002-treated cells. To test quality of prepared fractions, Western blots for marker proteins identifying lipid rafts (flotillin) and endosomes (Rab5) were performed. c Western blot analysis of APP from membrane fractions separated via sucrose gradient density centrifugation of SHSY5Y and siIRS-2 cells treated with or without LY294002. d Western blot analysis of APP CTFs of membrane fractions separated via sucrose gradient density centrifugation of SHSY5Y cells treated with inhibitors of α-, β-, or γ-secretase and respective controls. e Western blot analysis of the different secretases under normal culture conditions and overnight serum starvation. f α- and β-Secretase activity in SHSY5Y cells with and without PI3K (LY294002) inhibitor treatment. Data are means±SD. n = 4 per group. g β-Secretase activity assays from hippocampi of nIGF-1R−/− and nIR−/− mice and respective controls. n = 4–6 per group, *p < 0.05
Fig. 4
Fig. 4
Kaplan–Meier analysis and metabolic characterization of nIGF-1R+/−Tg2576 mice and respective controls up to 60 weeks of age. a Kaplan–Meier analysis. Survival was assessed from 229 female (117 wild type, 72 Tg2576, 28 nIGF-1R+/−, and 12 nIGF-1R+/−Tg2576) and 263 male mice (152 wild type, 60 Tg2576, 33 nIGF-1R+/−, and 18 nIR+/−Tg2576). *p < 0.05 (Wilcoxon rank test). b Glucose tolerance tests (GTT) of mice aged 12 weeks. GTT was assessed from 132 female (67 wild type, 36 Tg2576, 18 nIGF-1R+/−, and 11 nIR+/−Tg2576) and 130 male mice (72 wild type, 27 Tg2576, 18 nIGF-1R+/−, and 13 nIR+/−Tg2576). Insulin tolerance tests (ITT) of mice aged 12 weeks. ITT was assessed from 124 female (62 wild type, 37 Tg2576, 16 nIGF-1R+/−, and 9 nIR+/−Tg2576) and 119 male mice (71 wild type, 23 Tg2576, 15 nIGF-1R+/−, and 10 nIR+/−Tg2576)
Fig. 5
Fig. 5
IR/IGF-1R signaling and amyloid metabolism of nIGF-1R+/−Tg2576 and respective control mice aged 60 weeks. a Western blot analysis of ApoE, IRS-1, IDE, pAktser473, pGSK-3βser9, pErk-1/-2Thr202/Tyr204, and respective loading controls. b Western blots of hippocampal lysates for amyloid precursor protein (APP), IR, C-terminal fragment-α (αCTF), and βCTF, n = 4 per group. c Western blot analysis of Aβ oligomers using β-amyloid1–17 antibodies. d ELISA of β-amyloid1–40/1–42 peptides from Aβ-guanindine-HCl extractions of hippocampi. n = 4 per group. Data represent means±SEM. Age matched animals without APPsw and/or Syn-Cre expression served as controls. *p < 0.05 (Student’s t test). e Quantification of APP expression in hippocampi of nIGF-1R+/−Tg2576 and Tg2576 mice. n = 6 per group
Fig. 6
Fig. 6
Kaplan–Meier analysis and metabolic characterization of FoxO1ADATg2576 mice and respective controls up to 60 weeks of age. a Kaplan–Meier analysis. Survival was assessed from 235 female (122 wild type, 77 Tg2576, 22 FoxO1ADA, and 14 FoxO1ADATg2576) and 229 male mice (128 wild type, 66 Tg2576, 33 FoxO1ADA, and 2 FoxO1ADATg2576). *p < 0.05 (Wilcoxon rank test). b Glucose tolerance tests (GTT) of mice aged 10–11 weeks. GTT was assessed from 78 female (20 wild type, 24 Tg2576, 21 FoxO1ADA, and 13 FoxO1ADATg2576) and 68 male mice (29 wild type, 13 Tg2576, 23 FoxO1ADA, and 2 FoxO1ADATg2576). Insulin tolerance tests (ITT) of mice aged 10–11 weeks. ITT was assessed from 82 female (21 wild type, 27 Tg2576, 21 FoxO1ADA, and 13 FoxO1ADATg2576) and 75 male mice (30 wild type, 19 Tg2576, 23 FoxO1ADA, and 3 FoxO1ADATg2576). c Western blot analysis of FoxO1 and eGFP expression in hippocampus and cortex of FoxO1ADA mice and respective controls. d Western blot of hippocampal expression of amyloid precursor protein (APP), Western blot analysis of C-terminal fragment-α (αCTF), and βCTF at 60 weeks of age. e Western blot analysis of Aβ oligomers using β-amyloid1–17 antibodies at 60 weeks of age. f ELISA of β-amyloid1–40/1–42 peptides from Aβ-guanindine-HCl extractions of hippocampi at 60 weeks of age. n = 4 per group. Data represent means±SEM. Age matched animals without APPsw and/or Syn-Cre expression served as controls. *p < 0.05 (Student’s t test)
Fig. 7
Fig. 7
Kaplan–Meier analysis and metabolic characterization of FoxO1DNTg2576 mice and respective controls up to the age of 60 weeks. a Kaplan–Meier analysis. Survival was assessed from 168 female (71 wild type, 48 Tg2576, 35 FoxO1DN, and 14 FoxO1DNTg2576) and 143 male mice (67 wild type, 35 Tg2576, 29 FoxO1DN, and 12 FoxO1DNTg2576). *p < 0.05 (Wilcoxon rank test). b Glucose tolerance tests (GTT) of mice aged 10–11 weeks. GTT was assessed from 118 female (38 wild type, 37 Tg2576, 32 FoxO1DN, and 11 FoxO1DNTg2576) and 97 male mice (38 wild type, 29 Tg2576, 21 FoxO1DN, and 9 FoxO1DNTg2576). Insulin tolerance tests (ITT) of mice aged 10–11 weeks. ITT was assessed from 116 female (38 wild type, 36 Tg2576, 32 FoxO1DN, and 10 FoxO1DNTg2576) and 98 male mice (38 wild type, 29 Tg2576, 22 FoxO1DN, and 9 FoxO1DNTg2576). c Western blot analysis of FoxO1DN and eGFP expression in hippocampus and cortex of FoxO1DN mice and respective controls. d Western blot of hippocampal expression of amyloid precursor protein (APP), Western blot analysis of C-terminal fragment-α (αCTF), and βCTF at 60 weeks of age. e Western blot analysis of Aβ oligomers using β-amyloid1–17 antibodies at 60 weeks of age. f ELISA of β-amyloid1–40/1–42 peptides from Aβ-guanindine-HCl extractions of hippocampi at 60 weeks of age. n = 4 per group. Data represent means±SEM. *p < 0.05 (Student’s t test)

Similar articles

Cited by

References

    1. Adachi M, Osawa Y, Uchinami H, Kitamura T, Accili D, Brenner DA. The forkhead transcription factor FoxO1 regulates proliferation and transdifferentiation of hepatic stellate cells. Gastroenterology. 2007;132:1434–1446. doi: 10.1053/j.gastro.2007.01.033. - DOI - PubMed
    1. Adlerz L, Holback S, Multhaup G, Iverfeldt K. IGF-1-induced processing of the amyloid precursor protein family is mediated by different signaling pathways. J Biol Chem. 2007;282:10203–10209. doi: 10.1074/jbc.M611183200. - DOI - PubMed
    1. Baird PA, Sadovnick AD. Life expectancy in Down syndrome adults. Lancet. 1988;2:1354–1356. doi: 10.1016/S0140-6736(88)90881-1. - DOI - PubMed
    1. Belgardt BF, Husch A, Rother E, Ernst MB, Wunderlich FT, Hampel B, Klockener T, Alessi D, Kloppenburg P, Bruning JC. PDK1 deficiency in POMC-expressing cells reveals FoxO1-dependent and -independent pathways in control of energy homeostasis and stress response. Cell Metab. 2008;7:291–301. doi: 10.1016/j.cmet.2008.01.006. - DOI - PubMed
    1. Bruning JC, Gautam D, Burks DJ, Gillette J, Schubert M, Orban PC, Klein R, Krone W, Muller-Wieland D, Kahn CR. Role of brain insulin receptor in control of body weight and reproduction. Science. 2000;289:2122–2125. doi: 10.1126/science.289.5487.2122. - DOI - PubMed

Publication types

Substances