. 2012 Feb;40(4):1424-37.
doi: 10.1093/nar/gkr903. Epub 2011 Nov 3.

pre-miRNA profiles obtained through application of locked nucleic acids and deep sequencing reveals complex 5'/3' arm variation including concomitant cleavage and polyuridylation patterns

Affiliations

pre-miRNA profiles obtained through application of locked nucleic acids and deep sequencing reveals complex 5'/3' arm variation including concomitant cleavage and polyuridylation patterns

A Maxwell Burroughs et al. Nucleic Acids Res. 2012 Feb.

Abstract

Recent research hints at an underappreciated complexity in pre-miRNA processing and regulation. Global profiling of pre-miRNA and its potential to increase understanding of the pre-miRNA landscape is impeded by overlap with highly expressed classes of other non coding (nc) RNA. Here, we present a data set excluding these RNA before sequencing through locked nucleic acids (LNA), greatly increasing pre-miRNA sequence counts with no discernable effect on pre-miRNA or mature miRNA sequencing. Analysis of profiles generated in total, nuclear and cytoplasmic cell fractions reveals that pre-miRNAs are subject to a wide range of regulatory processes involving loci-specific 3'- and 5'-end variation entailing complex cleavage patterns with co-occurring polyuridylation. Additionally, examination of nuclear-enriched flanking sequences of pre-miRNA, particularly those derived from polycistronic miRNA transcripts, provides insight into miRNA and miRNA-offset (moRNA) production, specifically identifying novel classes of RNA potentially functioning as moRNA precursors. Our findings point to particularly intricate regulation of the let-7 family in many ways reminiscent of DICER1-independent, pre-mir-451-like processing, introduce novel and unify known forms of pre-miRNA regulation and processing, and shed new light on overlooked products of miRNA processing pathways.


Figures

Figure 1.
Figure 1.
Overview of LNA/DNA targeting technique. LNA/DNA oligos are added to the RNA library preparation prior to the cDNA synthesis step and are designed to interact directly with RNA targets, inhibiting the reverse transcription (RT) reaction as they cannot be used as RT primers. Examples of some designed LNA/DNAs are provided at the bottom of the figure; the complete list is available in Supplementary Data set S1.
Figure 2.
Figure 2.
General features of LNA(+) libraries. (A) Relative enrichment of pre-miRNA sequences in LNA(+) versus corresponding LNA(−) library as a percentage of the total number of sequences within a library. (B) Table showing raw number of pre-miRNA sequences and the number of pre-miRNA loci with at least one sequence identified in each library. (C) Comparison of pre-miRNA sequence expression normalized to tags per ten million (tptm) across LNA(−) and LNA(+) conditions in the total cell fraction, see Supplementary Figure S3 for comparisons across cytoplasmic, nuclear and mature fractions. (D) Comparison of pre-miRNA sequence expression (tptm) across nuclear and cytoplasmic fractions. (E) Comparison of LNA(+) pre-miRNA expression in the total fraction against publicly available total short-read miRNA expression in HeLa cells (42) (summing mature miRNA and miRNA* sequences within individual loci) normalized to the tags per million miRNA within a library (tpmm). (F) Comparison of length distributions across different libraries alongside miRBase reference lengths (36) (‘Materials and Methods’ section).
Figure 3.
Figure 3.
Analysis of pre-miRNA sequence features. (A) Analysis of heterogeneity at the 5′ (left side) and 3′ (right side) ends of pre-miRNA relative to mature miRNA considering unique sequences in total cellular fractions. Proportions of sequences in a given library are plotted against the location of their 5′ and 3′ ends relative to the primary pre-isomir (pre-miRNA) or primary isomiR (mature miRNA) normalized to the zero point in all line charts. Negative numbers refer to positions internal to the pre-miRNA hairpin. The top plot shows proportions for all unique sequences in the libraries, the bottom charts show proportions for all exactly mapping unique sequences in the libraries. A black box highlights the extended region of 3′ end variation resulting from poly(U)-tailing when examining all sequences (top right) and the lack of this feature when examining only exactly matching sequences (bottom right). (B and C) Plotting the proportion of nucleotide mismatches in pre-miRNA sequences from the total cellular fraction at labeled positions around a zero point normalized to (B) the 3′ end of the primary pre-isomir and (C) the miRBase-defined 3′ end point of the mature or miRNA* sequence derived from the 3′ arm of the pre-miRNA hairpin. (D and E) Proportion of sequences with poly(U) tails (D) and poly(U) tail length distributions (E) in each cellular fraction. (F) List of loci with identified poly(U) tails, divided into loci with the LIN28A recognition motif in the experimentally determined relevant location of the pre-miRNA hairpin and those lacking such a motif. ‘^’ denotes loci containing poly(U) tails at the miRBase-defined 3′ end. (G) Proportion of poly(U) tails occurring across the two sets of loci defined in (F) in each cellular fraction.
Figure 4.
Figure 4.
Concomitant pre-miRNA cleavage and polyuridylation. (A) Frequency and enrichment of sequences with 3′ nuclease activity, compared with polyuridylation events. (B) Histogram plotting the proportions of 3′ ends of unique sequences and unique sites of polyuridylation initiation in LIN28A binding motif-containing pre-miRNA sequences, revealing concomitant periodicity at −10, −20 and −30 nt peaks. Zero point in the histogram refers to 3′ end of the mature miRNA/miRNA* sequence derived from the 3′ pre-miRNA arm defined by miRBase. Negative values refer to points internal to the pre-miRNA hairpin. See Supplementary Figures S9–10, S12 for comparisons involving set of all sequences and across nuclear and cytoplasmic fractions. (C) Predicted hairpin structure of pre-let-7b with barplot representing the total number of raw counts in the total cellular fraction with 3′ cleavage events (green) and polyuridylation initiation sites (purple). LIN28A recognition site is colored in red (see also Supplementary Figure S11). (D) Boxplot comparing average nucleotide pairing probability for set of pre-miRNAs with 3′ cleavage events (‘3′C’) against those lacking cleavage events (‘NC’). While little difference is observed in the average pairing probabilities for the first five nucleotides when counting from the 5′ base of the stem, as more nucleotides are included in the calculations the differences are significant (at 15 nt, Wilcox rank sum test, P = 0.0048; at 20 nt, P = 0.0024). (E) Histogram depicting proportion of 5′ cleavage events at given locations across all pooled libraries, revealing clear peak in the 20–23 nt range (see also Supplementary Figure S14 and Table S6).
Figure 5.
Figure 5.
fpRNA and ppiRNA in relation to moRNA. (A and B) Relative abundance of fpRNA and moRNA to their cognate pre-miRNA and mature miRNA sequences. (C) Slight enrichment is observed in fpRNA located adjacent to 3′ arm of the pre-miRNA in both nuclear and cytoplasmic fractions, tpm normalized to facilitate comparison across the fractions. (D) Boxplot depicting the significant enrichment (Wilcox rank sum test, P = 9.2e−5) of moRNA sequences derived from polycistronic pri-miRNA transcripts. (E) Enrichment of ppiRNA sequences in both the nuclear fraction and relative to pre-miRNA sequences derived from polycistronic pri-miRNA transcripts, tpm normalized. (F and G) Line plots depicting proportion of moRNA sequences relative to distances from the inferred DROSHA cleavage point for moRNA derived from polycistronic (brown) and non-polycistronic (green) pri-miRNA transcripts from regions adjacent to the 3′ (F) and 5′ (G) ends of pre-miRNA hairpins. Little difference is observed, suggesting similar modes of processing while the range of lengths in moRNA sequences argues against consistent cleavage points. (H and I) Line plots depicting proportions of fpRNA sequences with 3′ (orange) or 5′ (black) edges remaining at the indicated distances from the most-frequently occurring, inferred DROSHA-mediated cleavage point separating pre-miRNA from fpRNA sequences in the cytoplasmic (H) and nuclear (I) fractions. (H and I) are both indicative of possible 3′–5′ exonucleolytic processing likely unrelated to moRNA production.
Figure 6.
Figure 6.
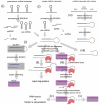
Overview of pre-miRNA processing. (i) Canonical pre-miRNA processing pathway, beginning with DROSHA processing of polycistronic or single miRNA transcripts and ending with formation of RISC complex with DICER1-processed mature miRNA. The polycistronic pre-miRNA intervening RNA (ppiRNA) and flanking pre-miRNA (fpRNA) products of DROSHA processing are further processed into miRNA offset RNA (moRNA) by undetermined mechanisms (dashed arrows). (ii and iii) Potential processing pathways involving LIN28A-like regulatory factor association: (ii) LIN28A blocks DICER1 uptake and recruits the polyuridyltransferase ZCCHC11 leading to 3′ poly(U) tail formation and pre-miRNA degradation and (iii) LIN28A or other factor association coinciding with AGO2 association leads to AGO2-mediated single-stranded hairpin cleavage followed by repeated polyuridylation and exonuclease activity restricted to the −20 nt position by factor binding (iii). While the let-7 family is most strongly affected by the process beginning at (iii), consistent with the low frequency of 3′ arm-derived let-7* sequences observed in miRBase (36), a wide range of additional loci are also affected (Supplementary Table S5). (iv) The end products of (iii) could either be RNAi-active, capable of binding target mRNA sequences, or could regulate pre-miRNA activity by sequestering inactivated hairpins. (v) On relatively rare occasions, the pre-miRNA hairpin could be processed through polyuridylation and subsequent polyuridylation activity after factor disassociation to lengths consistent with DICER1-processed mature sequences (Supplementary Figure S19 and S20). (vi) Mirtrons excised from mRNA transcripts via the splicing machinery may result in hairpins with 5′ overhangs (Supplementary Figure S13). 3′ polyuridylation could provide 3′ overhangs for cytoplasmic export. (vii) Some pre-miRNA loci are subject to 5′ cleavage, possibly processed by single-nick DICER1 activity (Supplementary Figure S15).

References

    1. Bartel DP. MicroRNAs: genomics, biogenesis, mechanism, and function. Cell. 2004;116:281–297. - PubMed
    1. Gregory RI, Yan KP, Amuthan G, Chendrimada T, Doratotaj B, Cooch N, Shiekhattar R. The Microprocessor complex mediates the genesis of microRNAs. Nature. 2004;432:235–240. - PubMed
    1. Han J, Lee Y, Yeom KH, Nam JW, Heo I, Rhee JK, Sohn SY, Cho Y, Zhang BT, Kim VN. Molecular basis for the recognition of primary microRNAs by the Drosha-DGCR8 complex. Cell. 2006;125:887–901. - PubMed
    1. Lund E, Guttinger S, Calado A, Dahlberg JE, Kutay U. Nuclear export of microRNA precursors. Science. 2004;303:95–98. - PubMed
    1. Okada C, Yamashita E, Lee SJ, Shibata S, Katahira J, Nakagawa A, Yoneda Y, Tsukihara T. A high-resolution structure of the pre-microRNA nuclear export machinery. Science. 2009;326:1275–1279. - PubMed

Publication types