. 2012 Feb;120(3):440-52.
doi: 10.1111/j.1471-4159.2011.07576.x. Epub 2011 Nov 28.

α-Synuclein oligomers oppose long-term potentiation and impair memory through a calcineurin-dependent mechanism: relevance to human synucleopathic diseases

Affiliations

α-Synuclein oligomers oppose long-term potentiation and impair memory through a calcineurin-dependent mechanism: relevance to human synucleopathic diseases

Zane S Martin et al. J Neurochem. 2012 Feb.

Abstract

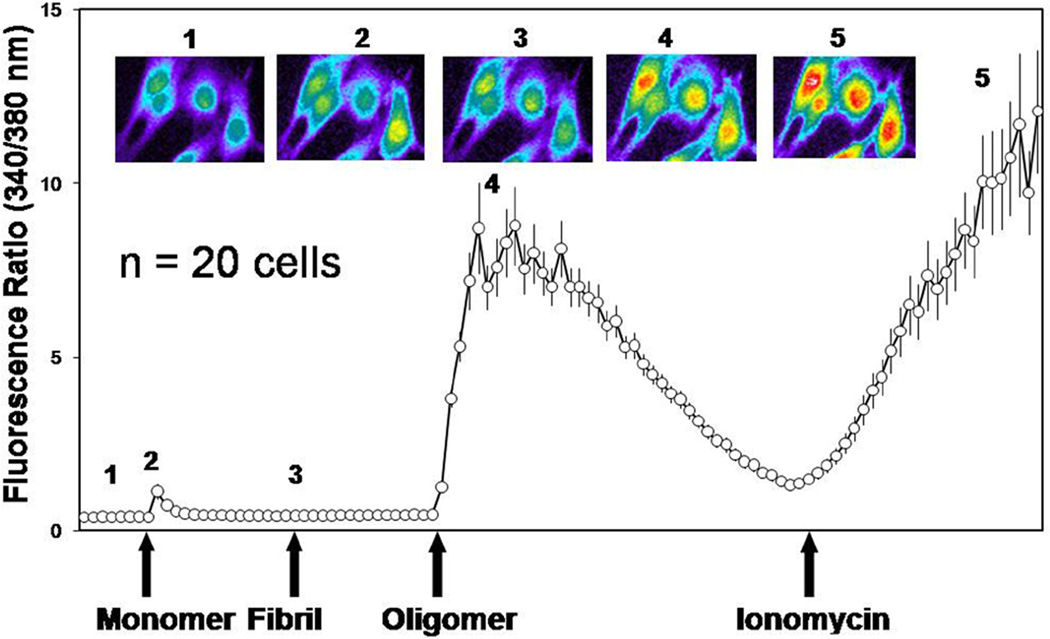
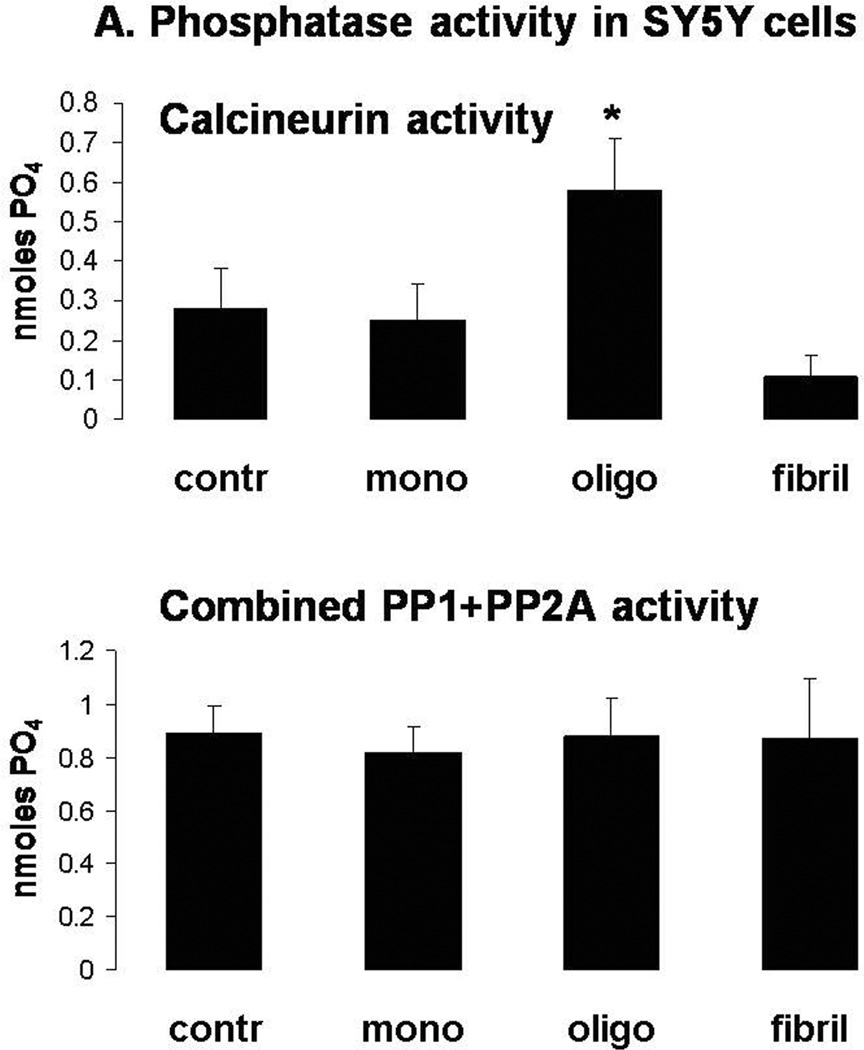
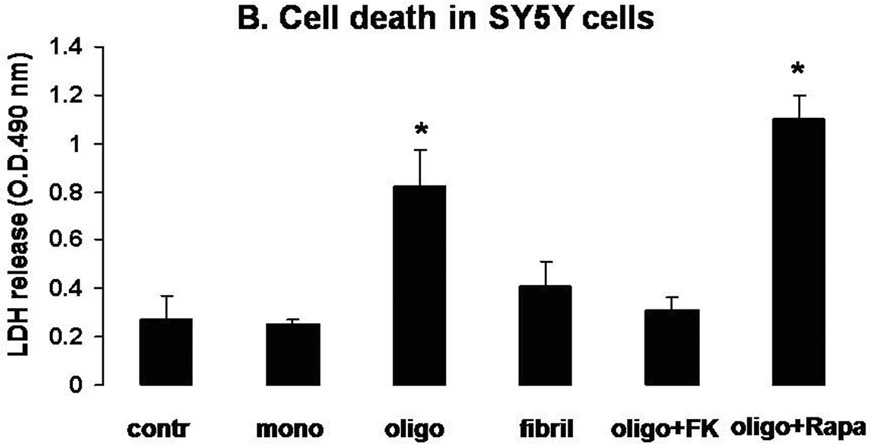
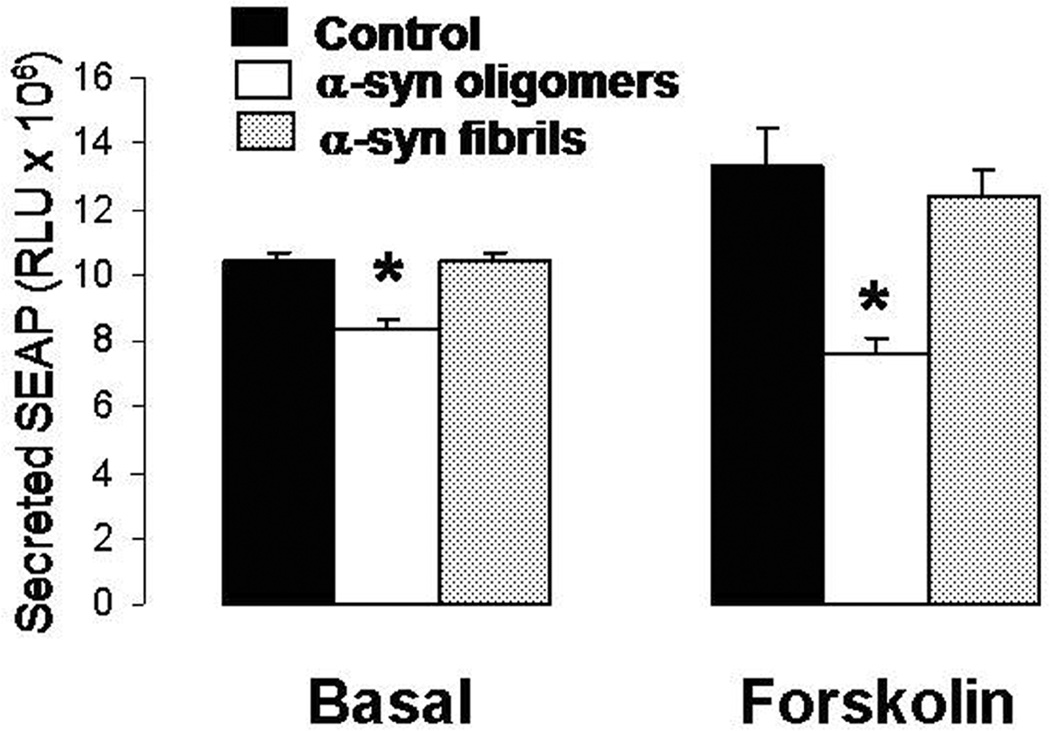
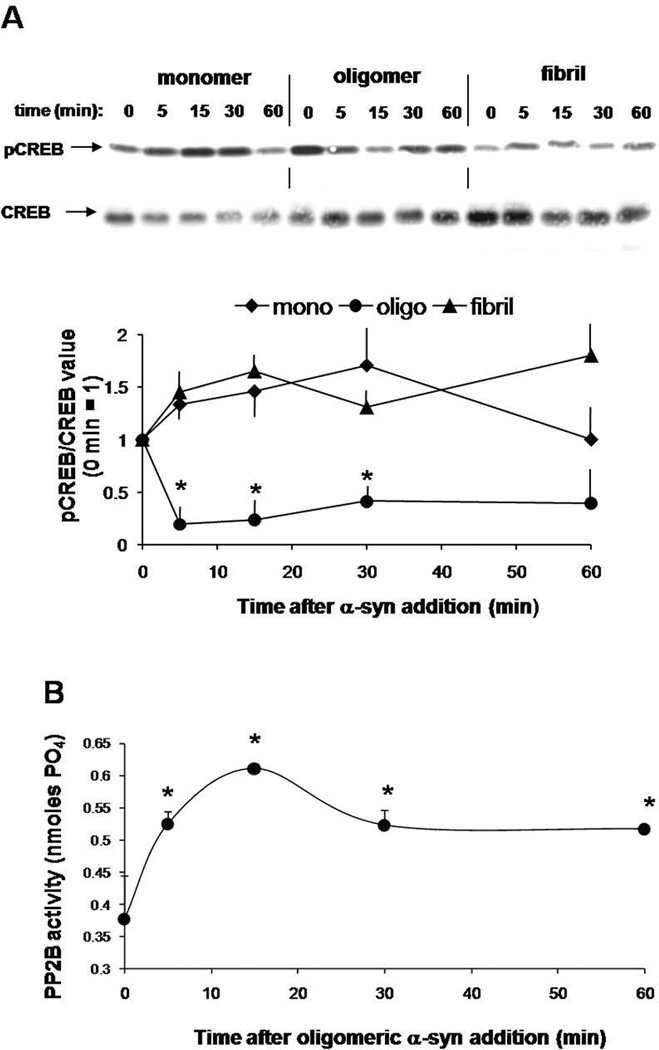
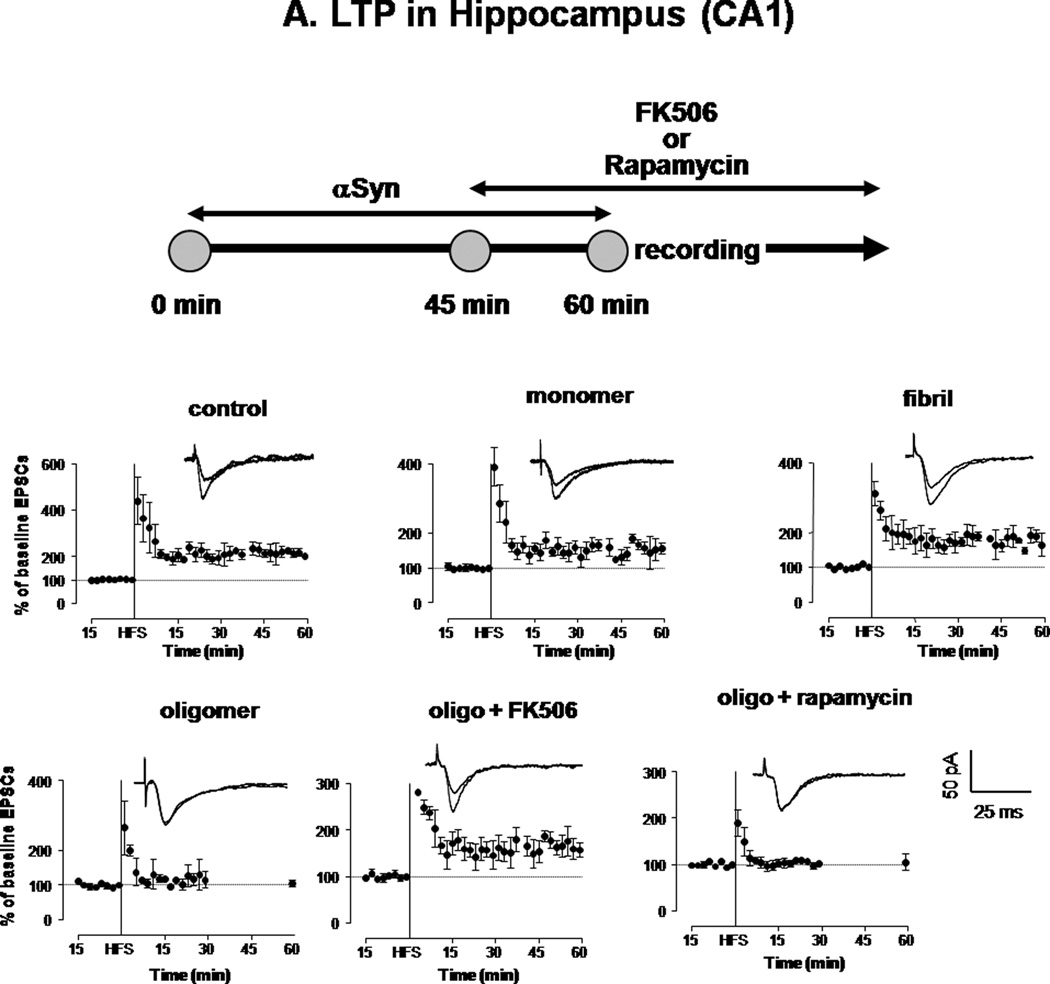
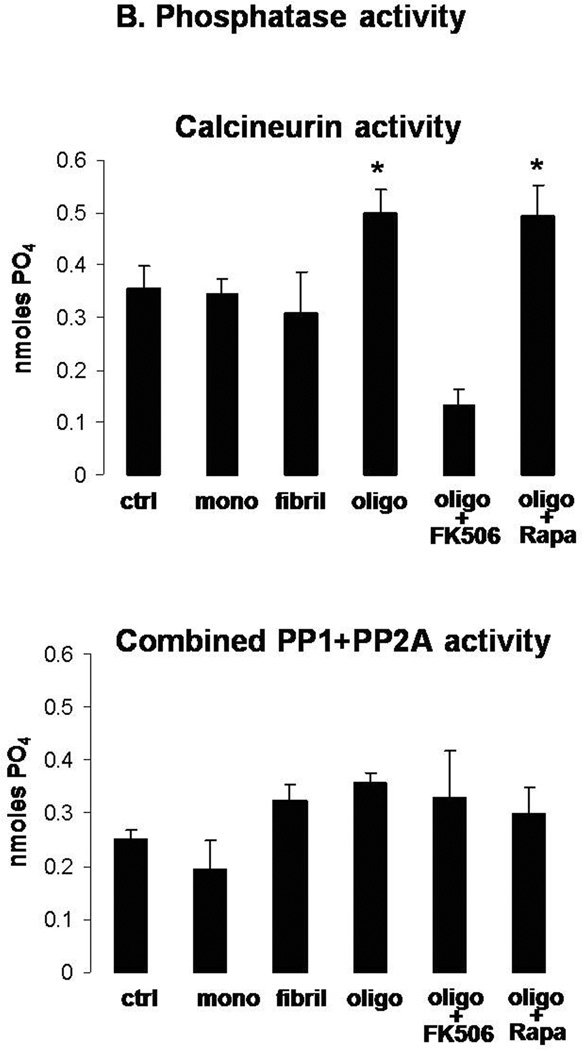
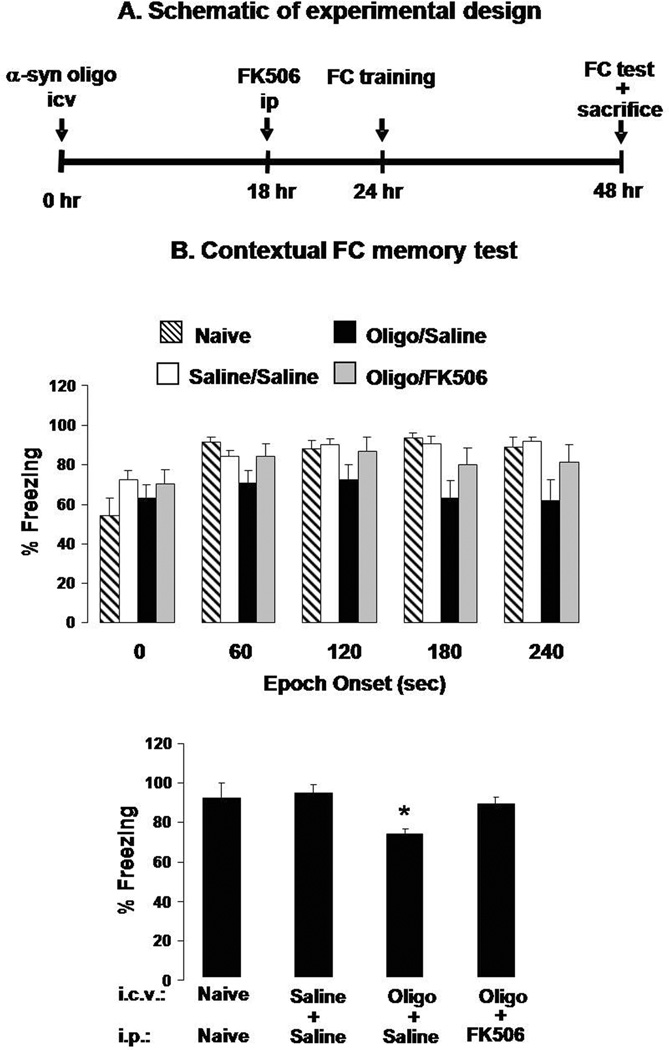
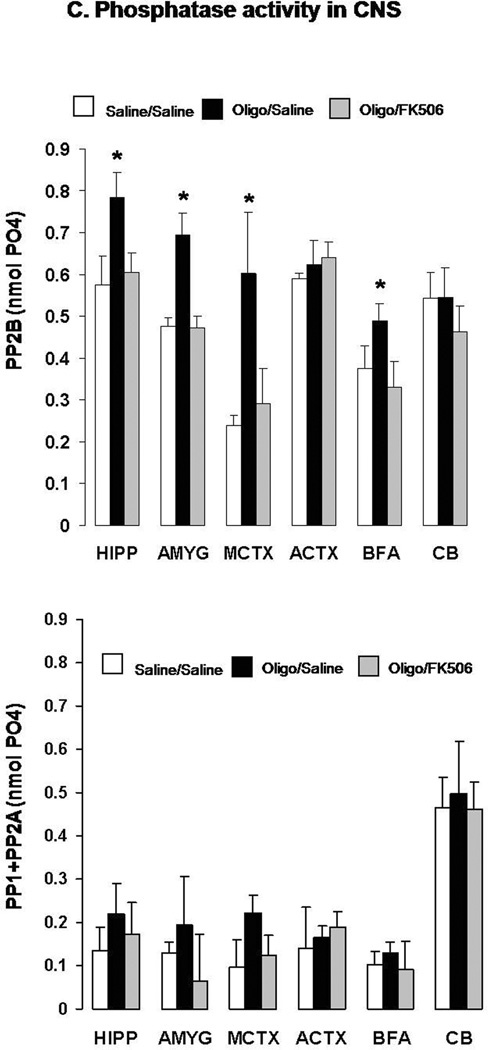
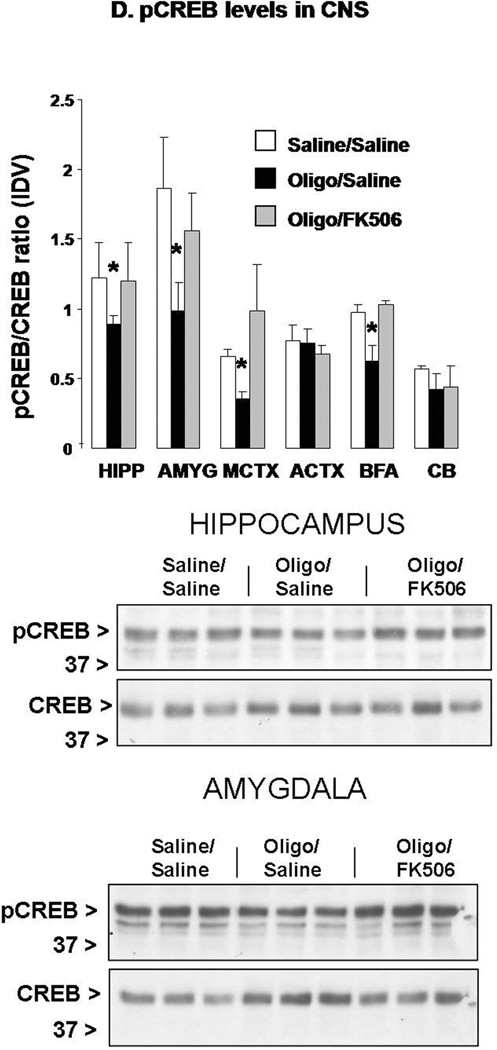
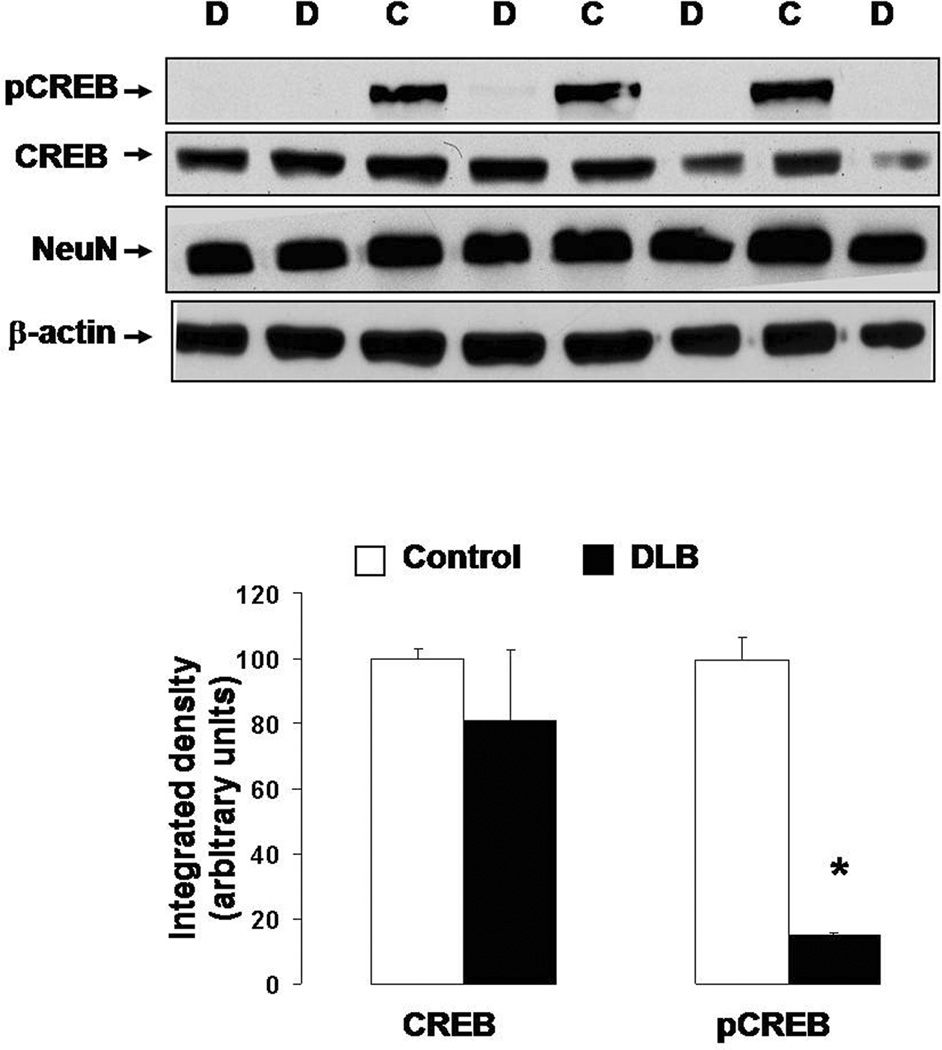
Intracellular deposition of fibrillar aggregates of α-synuclein (αSyn) characterizes neurodegenerative diseases such as Parkinson's disease (PD) and dementia with Lewy bodies. However, recent evidence indicates that small αSyn oligomeric aggregates that precede fibril formation may be the most neurotoxic species and can be found extracellularly. This new evidence has changed the view of pathological αSyn aggregation from a self-contained cellular phenomenon to an extracellular event and prompted investigation of the putative effects of extracellular αSyn oligomers. In this study, we report that extracellular application of αSyn oligomers detrimentally impacts neuronal welfare and memory function. We found that oligomeric αSyn increased intracellular Ca(2+) levels, induced calcineurin (CaN) activity, decreased cAMP response element-binding protein (CREB) transcriptional activity and resulted in calcineurin-dependent death of human neuroblastoma cells. Similarly, CaN induction and CREB inhibition were observed when αSyn oligomers were applied to organotypic brain slices, which opposed hippocampal long-term potentiation. Furthermore, αSyn oligomers induced CaN, inhibited CREB and evoked memory impairments in mice that received acute intracerebroventricular injections. Notably, all these events were reversed by pharmacological inhibition of CaN. Moreover, we found decreased active CaN and reduced levels of phosphorylated CREB in autopsy brain tissue from patients affected by dementia with Lewy bodies, which is characterized by deposition of αSyn aggregates and progressive cognitive decline. These results indicate that exogenously applied αSyn oligomers impact neuronal function and produce memory deficits through mechanisms that involve CaN activation.


Figures

Figure 1
Figure 1. αSyn oligomers, but not monomers or fibrils, increases intracellular Ca2+ levels in SY5Y cells
Graph showing a 35 min time course of Ca2+-dependent fluorescence recorded and averaged from 20 fluo-3 loaded SY5Y cells in response to consecutive application of αSyn monomers, fibrils, and oligomers (2 µM for 10 min each). Cells were challenged with ionomycin (2 µM) at the conclusion of the experiment. Each point represents the average of the 340/380 nm readings from 20 individual cells. Representative images (top) depict the response of 4 individual cells at the time points indicated by the corresponding number on graph. Warmer colors correspond to a higher level of fluorescence.
Figure 2
Figure 2. Selective induction of CaN activity and CaN-dependent cell death by oligomeric αSyn in SY5Y cells
A. CaN (top) and combined PP1+PP2A (bottom) activity in SY5Y cells treated for 24 h with 2 µM αSyn monomers, oligomers or fibrils. Graph is representative of 2 independent experiments returning similar results. n=3 independent measurements per condition; *: p<0.05 vs. control group (ANOVA). B. LDH release in the culture medium of SY5Y cells treated for 24 h with 2 µM αSyn monomers, oligomers or fibrils. Separate dishes of oligomer-treated cells were additionally treated with FK506 (10 µM) or rapamycin (10 µM). Graph is representative of 2 independent experiments returning similar results. n=4–6 independent measurements per condition; *: p<0.01 vs. control group (ANOVA).
Figure 3
Figure 3. CREB-promoted transcriptional activity is inhibited by oligomeric αSyn in both basal and AC/PKA-stimulated conditions in SY5Y cells
Release of the reported gene product SEAP in SY5Y cells transiently transfected with the CREB-sensitive CRE-SEAP construct and treated for 3 h with oligomeric or fibrillary αSyn (2 µM) in the presence or absence of the AC/PKA activator forskolin (10 µM). n=6 replicates per group; *: p<0.01 vs. control cells (ANOVA).
Figure 4
Figure 4. Oligomeric αSyn reduces pCREB levels and coincidentally increases CaN activity in organotypic rat brain slices
A. Representative Western blot (top) detecting pCREB in total protein extracts from organotypic brain slices treated with 0.75 µM of monomeric, oligomeric and fibrillar αSyn for the time length shown. The blot was stripped and re-probed for total CREB to control for sample gel loading. Densitometry band quantification (bottom) confirmed that pCREB levels were significantly reduced by aSyn oligomers but not monomers or fibrils. The graph shows the average from 3 independent experiments. *: p<0.05 vs. time 0 control (ANOVA). B. CaN activity assay in homogenates from rat brain slices treated with 0.75 µM oligomeric αSyn for the times indicated. n=3 replicates per time point. *: p<0.05 vs. time 0 control (ANOVA).
Figure 5
Figure 5. Oligomeric αSyn decreases LTP expression in hippocampal neurons in a CaN-dependent fashion
A. HFS-induced expression of LTP in the hippocampus (CA1) of rat brain slices treated for 1 h with vehicle (control) or with 0.5 µM monomeric, oligomeric or fibrillar αSyn. A parallel set of oligomer-treated slices were additionally treated (45 min after addition of αSyn) with FK506 (10 µM) or rapamycin (10 µM), which remained in the perfusion buffer throughout the recording. Each symbol is the average of 10 monosynaptic EPSCs. Peak amplitudes were measured and expressed as percent of baseline values before HFS. Individual traces in inserts show averaged EPSCs recorded before and 30 min after HFS. Monosynaptic EPSCs were evoked by electrical stimulation (200 µs square-wave pulses at 0.033 Hz) of the Schaffer collateral/commissural pathway. LTP was evoked by 3 high-frequency trains (100 Hz, 1 s duration each; intertrain-interval 20 s). For illustration purposes, all scales were set to a maximum of 400 %. B. CaN (top) and PP1+PP2A combined activity (bottom) assayed in the same brain slices shown in A at the end of the LTP recording. Columns represent mean ± S.D.; n=3 per group; *: p<0.05 vs. control (ANOVA).
Figure 6
Figure 6. An acute ICV injection of αSyn oligomers coincidentally induces CaN activity, decreases pCREB, and impairs FC memory in mice
A. A schematic illustrating the experimental design used in these experiments. αSyn oligomers (100 pmole/3 µl/mice) were injected ICV 24 h prior to FC training (48 h prior to FC test and sacrifice). Prior to FC training half of the mice were treated with FK506 (10 mg/kg IP) and half received saline. B. Contextual FC test scores in naïve mice and mice treated with saline ICV followed by saline IP (Saline/Saline) or αSyn ICV followed by saline ip (Oligo/Saline) or FK506 ip (oligo/FK506). Percent freezing (reflecting memory recollection) for each group is shown for each 60 sec block of a 240 sec test period (upper panel) or as cumulative data for the entire test period (lower panel). n=15 mice per group. **: p<0.01 vs. Saline/Saline or oligo/FK506 (ANOVA). C. CaN (top) and PP1+PP2A combined activity (bottom) in the hippocampus (HIPP), amygdala (AMYG), medial cortex (MCTX), anterior cortex (ACTX), basal forebrain area (BFA) and cerebellum (CB) of the same mice sacrificed at the end of the FC memory tests. D. Phosphorylated (active) CREB levels assayed by Western blot in the same brain areas from the same mice as shown in (D). Membranes were stripped and re-probed for total CREB and final values were expressed as ratio of pCREB/CREB calculated for each sample. Representative Western blots from this experiment detecting pCREB and CREB in the hippocampus and amygdala are shown at the bottom. n=5 mice per group (randomly chosen from the 15 per group used in behavioral studies). *: p<0.05 vs. Saline/Saline or oligo/FK506 (ANOVA).
Figure 7
Figure 7. Increased truncated (active) CaN and decreased pCREB in frontal cortex of DLB brains
(A) (Top) Representative Western blot detecting CaN-A in protein extracts from frontal cortex autopsy specimens from DLB patients (D) and age-matched controls (C). Membrane was stripped and re-probed for β-actin to ensure equal loading. (Bottom) Densitometric analysis of immunoreactive bands comparing the levels of the truncated CaN-A (corrected to β-actin) in frontal cortices from DLB patients (n=7) and age-matched controls (n=5). The average density value in control cases was arbitrarily set at 100. *: p<0.05 vs. control (ANOVA). (B) (Top) Representative Western blot detecting pCREB in protein extracts from the frontal cortex of DLB patients (D) and age-matched controls (C). Membranes were stripped and re-probed for total CREB, NeuN (neuronal marker), and β-actin (loading control). (Bottom) Densitometric analysis of immunoreactive bands comparing CREB and pCREB levels (both corrected to β-actin) in frontal cortices from DLB (n=7) and age-matched controls (n=5). The average density value in control cases was arbitrarily set at 100. *: p<0.001 vs. control (ANOVA).

References

    1. Abraham RT, Wiederrecht GJ. Immunopharmacology of rapamycin. Annu Rev Immunol. 1996;14:483–510. - PubMed
    1. Angot E, Steiner JA, Hansen C, Li JY, Brundin P. Are synucleinopathies prion-like disorders? Lancet Neurol. 2010;9:1128–1138. - PubMed
    1. Barnes CA. Involvement of LTP in memory: are we “searching under the street light”? Neuron. 1995;15:751–754. - PubMed
    1. Bartels T, Choi JG, Selkoe DJ. alpha-Synuclein occurs physiologically as a helically folded tetramer that resists aggregation. Nature. 2011;477:107–110. - PMC - PubMed
    1. Belmeguenai A, Hansel C. A role for protein phosphatases 1, 2A, and 2B in cerebellar long-term potentiation. J Neurosci. 2005;25:10768–10772. - PMC - PubMed

Publication types

MeSH terms