. 2012 Jan;10(1):11-24.
doi: 10.1158/1541-7786.MCR-11-0256. Epub 2011 Nov 7.

Fractalkine receptor CX(3)CR1 is expressed in epithelial ovarian carcinoma cells and required for motility and adhesion to peritoneal mesothelial cells

Affiliations

Fractalkine receptor CX(3)CR1 is expressed in epithelial ovarian carcinoma cells and required for motility and adhesion to peritoneal mesothelial cells

Mijung Kim et al. Mol Cancer Res. 2012 Jan.

Abstract

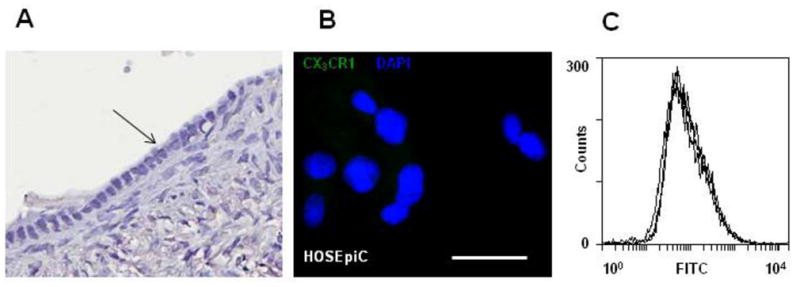
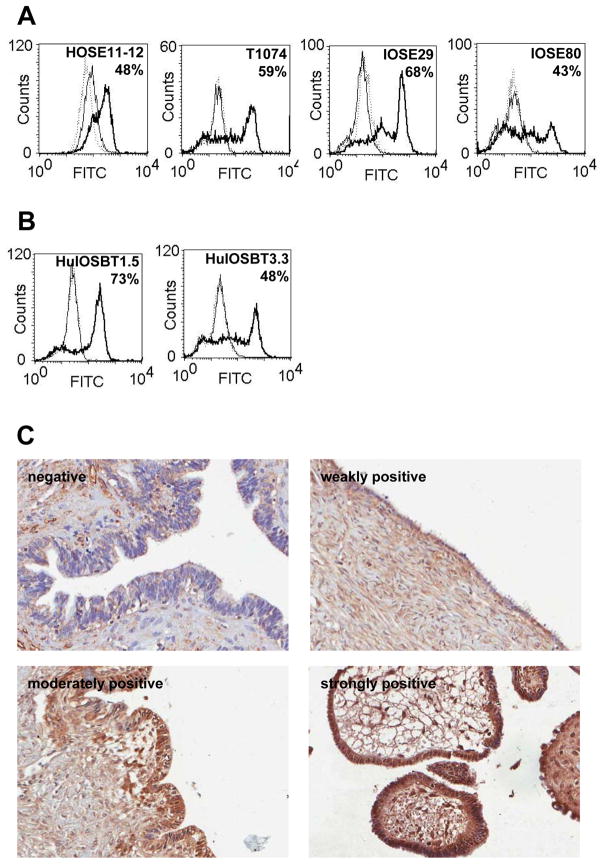
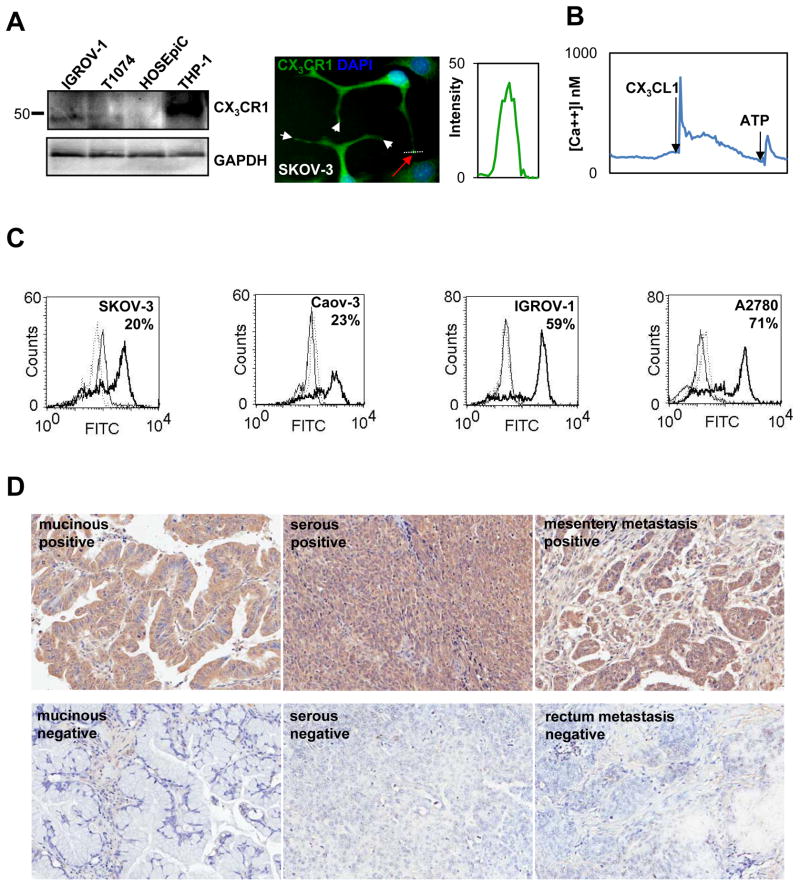
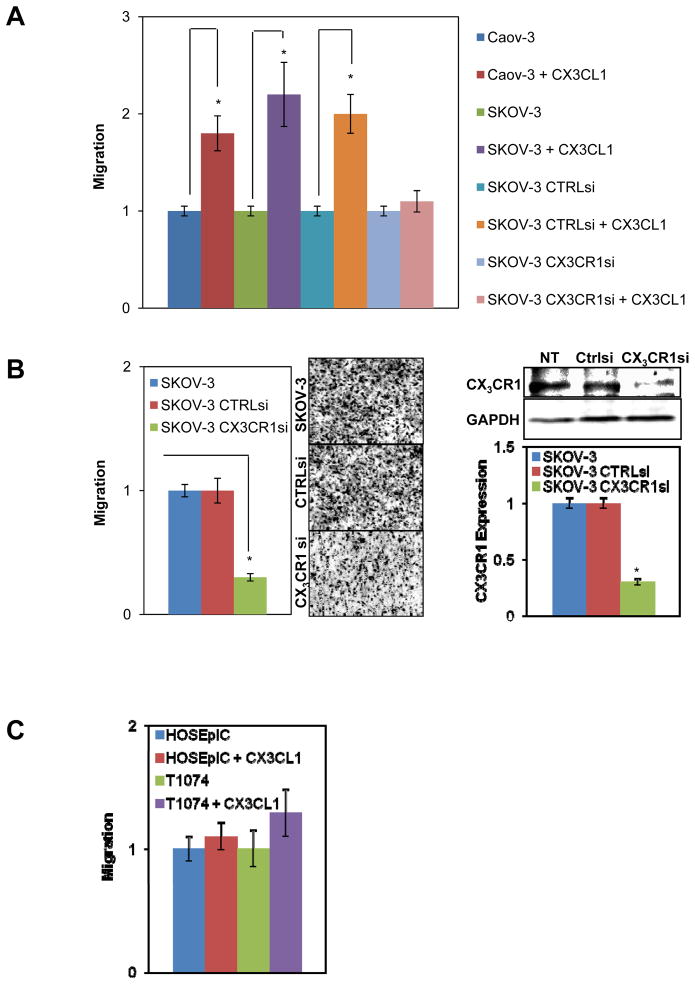
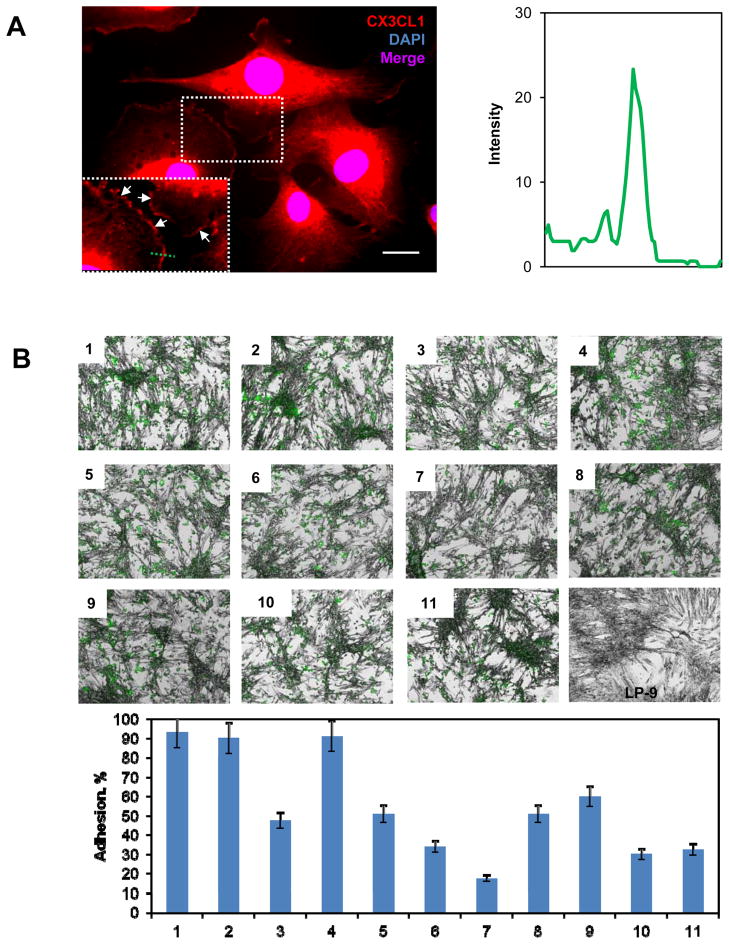
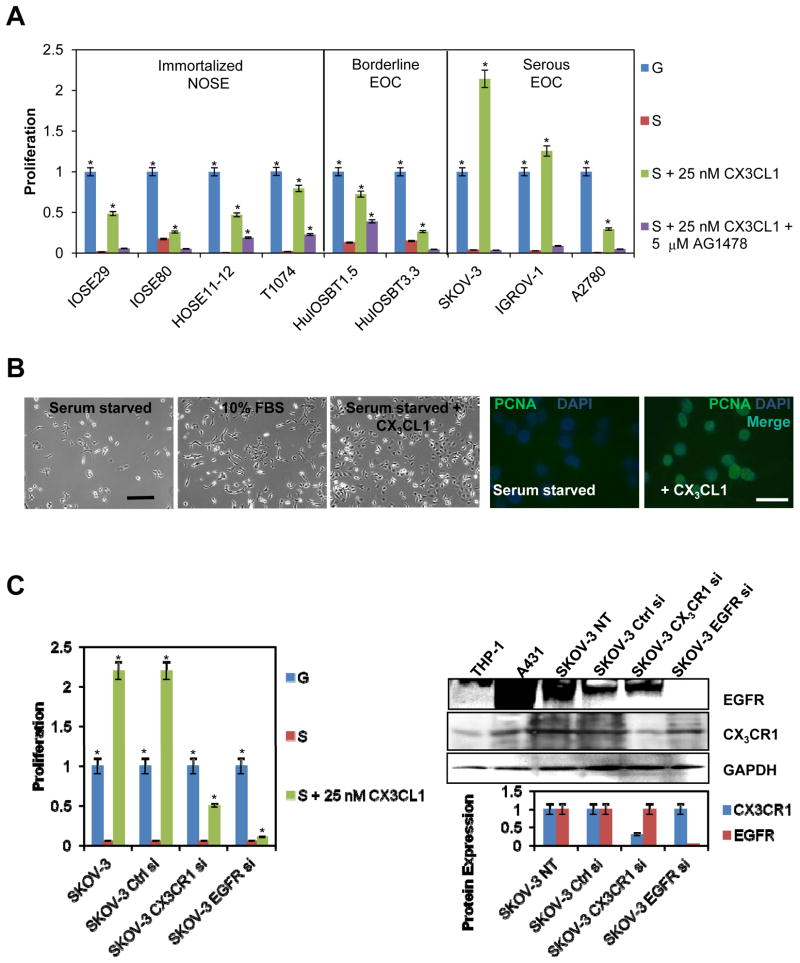
Epithelial ovarian carcinoma (EOC) is a deadly disease, and little is known about the mechanisms underlying its metastatic progression. Using human specimens and established cell lines, we determined that the G-protein-coupled seven-transmembrane fractalkine receptor (CX(3)CR1) is expressed in primary and metastatic ovarian carcinoma cells. Ovarian carcinoma cells robustly migrated toward CX(3)CL1, a specific ligand of CX(3)CR1, in a CX(3)CR1-dependent manner. Silencing of CX(3)CR1 reduced migration toward human ovarian carcinoma ascites fluid by approximately 70%. Importantly, adhesion of ovarian carcinoma cells to human peritoneal mesothelial cells was dependent on CX(3)CL1/CX(3)CR1 signaling. In addition, CX(3)CL1 was able to induce cellular proliferation. Together, our data suggest that the fractalkine network may function as a major contributor to the progression of EOC, and further attention to its role in the metastasis of this deadly malignancy is warranted.


Figures

Figure 1
Figure 1. CX3CR1 is not expressed in normal ovarian surface epithelium
(A) Samples from normal ovaries were examined for CX3CR1 expression by immunohistochemistry. The black arrow indicates the ovarian surface epithelium. Brown – CX3CR1; blue – hematoxylin. Images were generated using an Aperio ScanScope digital slide scanner. Magnification – 20×. (B) Expression of CX3CR1 in normal ovarian surface epithelial cells (HOSEpiC) was evaluated by immunofluorescent staining. CX3CR1 – green; DAPI – blue. Images were collected on the green and blue filters independently and then superimposed. Bar, 50μm. (C) Cell surface expression of CX3CR1 in HOSEpiC was analyzed by flow cytometry. CX3CR1 expression in HOSEpiC and negative controls (normal rabbit IgG plus FITC-conjugated goat anti-rabbit IgG and FITC-conjugated goat anti-rabbit IgG only) is shown. The results are representative of three independent experiments.
Figure 2
Figure 2. CX3CR1 is expressed in immortalized and borderline EOC cell lines as well as human serous cystadenoma specimens
Cell surface expression of CX3CR1 in immortalized NOSE (A) and borderline EOC cells lines (B) was analyzed by flow cytometry. The percentage of positive cells is indicated. Solid thick line – CX3CR1 expression; solid thin line – negative control (normal rabbit IgG and FITC-conjugated goat anti-rabbit IgG); dotted line – negative control (FITC-conjugated goat anti-rabbit IgG only). These data are representative of at least three independent experiments. (C) Expression of CX3CR1 in cases of benign serous cystadenoma was determined by immunohistochemistry. Brown – CX3CR1; blue – hematoxylin. Images were generated using an Aperio ScanScope digital slide scanner. Magnification – 10×. Examples of CX3CR1-negative (core C7, Supplemental Table 3), weakly positive (core B4, Supplemental Table 3), moderately positive (core D2, Supplemental Table 3), and strongly positive (core E3, Supplemental Table 3) specimens are presented.
Figure 3
Figure 3. CX3CR1 is expressed in primary and metastatic epithelial ovarian carcinoma
(A) CX3CR1 expression in normal ovarian surface epithelial cells (HOSEpiC), immortalized normal ovarian surface epithelial cells (T1074), and serous EOC cell line (IGROV-1) was evaluated by Western blot. GAPDH served as a loading control. THP-1 cell lysate was used as a positive control for CX3CR1 expression. Position of the marker lane of apparent molecular weight of 50 kDa is indicated. Expression of CX3CR1 in the serous EOC cell line (SKOV-3) was evaluated using immunofluorescence staining. CX3CR1 – green; DAPI – blue. Images were collected independently on the green and blue filters and subsequently superimposed. Bar, 10 μm. Histogram shows the intensity of CX3CR1 staining across the pseudopodial protrusions of SKOV-3 cells (white dotted line and red arrow). (B) Intracellular [Ca++] changes in response to 20 nM CX3CL1 indicate the presence of active CX3CR1 in EOC cells. An ATP-induced signal indicates live cells. (C) Cell surface expression of CX3CR1 in the indicated serous EOC cell lines was analyzed by flow cytometry. The percentage of positive cells is indicated. Solid thick line – CX3CR1 expression; solid thin line – negative control (normal rabbit IgG and FITC-conjugated goat anti-rabbit IgG); dotted line – negative control (FITC-conjugated goat anti-rabbit IgG only). These data are representative of at least three independent experiments. (D) Expression of CX3CR1 in cases of primary and metastatic EOC was determined by immunohistochemistry. Brown – CX3CR1; blue – hematoxylin. Images were generated using an Aperio ScanScope digital slide scanner. Magnification - 10×. Examples of CX3CR1-positive and CX3CR1-negative cases of mucinous adenocarcinoma (cores C10 and C5, respectively, Supplemental Table 1), serous carcinoma (cores I15 and G9, respectively, Supplemental Table 1), and metastatic serous carcinoma (cores J8 and L3, respectively, Supplemental Table 1) are displayed.
Figure 4
Figure 4. CX3CL1/CX3CR1-dependent cell migration
(A) Two EOC cell lines, Caov-3 and SKOV-3, were either not transfected, transfected with control siRNA, or transfected with CX3CR1 siRNA and then subjected to a cell migration assay in a Transwell chamber in the presence or absence of 5 nM CX3CL1 for 5 h. (B) SKOV-3 cells were either not transfected or transiently transfected with control or CX3CR1 siRNAs and then subjected to a Transwell cell migration assay using human peritoneal ascites fluid (specimen #5, respectively, Table 2). Images on the right illustrate the numbers of migrated cells in each condition. Downregulation of CX3CR1 by siRNA in SKOV-3 cells was analyzed by Western blot and quantified by digital densitometry. GAPDH served as a loading control. *p<0.05. (C) Normal ovarian surface epithelial cells (HOSEpiC) and immortalized ovarian surface epithelial cells (T1074) were allowed to migrate for 5 h in the presence or absence of 5 nM CX3CL1 in a Transwell chamber. The number of cells that migrated in the control condition without added CX3CL1 was set as “1”, and other values were calculated relative to this level. These data represent the average of three experiments performed in triplicate. *p<0.05.
Figure 5
Figure 5. EOC cells adhere to peritoneal mesothelial cells and Matrigel in a CX3CL1/CX3CR1-dependent manner
(A) Immunofluorescence analysis of CX3CL1 expression in LP-9 cells. The rabbit anti-human CX3CL1 antibody (BioVision) was used at a dilution of 1:50, and the goat anti-rabbit AlexaFluor546 antibody (Molecular Probes) was used at a dilution of 1:500. Nuclei were counterstained with DAPI. CX3CL1 – red; DAPI – blue. Images were collected independently with red and blue filters and subsequently superimposed. Bar, 5 μm. The insert shows a 1.5-fold enlarged rectangular area outlined by dotted lines. White arrows indicate membranous CX3CL1 staining. The histogram shows the intensity of CX3CL1 staining across the membrane of an LP-9 cell (along the green dotted line). (B) SKOV-3 cell adhesion to LP-9 monolayers is shown. LP-9 cells were cultured in monolayers. SKOV-3 cells were labeled with DiO, a fluorescent tracking dye, prior to the adhesion assays. Adhesion assays were performed over 5 h. Adhered cells were fixed with 4% paraformaldehyde, and images were taken using green fluorescence and bright field microscopy with a 5× magnification objective and a Zeiss fluorescent microscope. The images were then superimposed. Green – SKOV-3; grey – LP-9. The following conditions were evaluated: 1) SKOV3 adhesion to LP-9 cells; 2) control siRNA-transfected SKOV-3 cell adhesion to LP-9 cells; 3) CX3CR1 siRNA-transfected cell adhesion to LP-9 cells; 4) SKOV-3 cell adhesion to LP-9 cells pre-treated with IgG; 5) SKOV-3 cell adhesion to LP-9 cells pre-treated with 0.1 μg/ml CX3CL1 blocking antibodies; 6) SKOV-3 cell adhesion to LP-9 cells pre-treated with 1 μg/ml CX3CL1 blocking antibodies; 7) SKOV-3 cell adhesion to LP-9 cells pre-treated with 10 μg/ml CX3CL1 blocking antibodies; 8) SKOV-3 cell adhesion to LP-9 cells pre-treated with 1 μg/ml CD44 blocking antibodies and 1 μg/ml β1-integrin blocking antibodies; 9) control siRNA-transfected SKOV-3 cell adhesion to LP-9 cells pre-treated with 1 μg/ml CD44 blocking antibodies and 1 μg/ml β1-integrin blocking antibodies; 10) CX3CR1 siRNA-transfected SKOV-3 cell adhesion to LP-9 cells pre-treated with 1 μg/ml CD44 blocking antibodies and 1 μg/ml β1-integrin blocking antibodies; 9) SKOV-3 cell adhesion to LP-9 cells pre-treated with 1 μg/ml CX3CL1 blocking antibodies, 1 μg/ml CD44 blocking antibodies, and 1 μg/ml β1-integrin blocking antibodies. These data represent the average of three experiments performed in sextuplicate. A quantitative analysis of the adhesion data is presented in the histogram.
Figure 6
Figure 6. CX3CL1 is instrumental in promoting cell proliferation
(A) The proliferation rates of serum-starved IOSE, borderline EOC, and serous EOC cell lines were evaluated in the presence of 25 nM CX3CL1 (“S + 25 nM CX3CL1”, green bars) or 25 nM CX3CL1 plus 5 μM AG1478 (“S + 25 nM CX3CL1 + 5μM AG1478”, purple bars). Growth phase cells cultured in complete media containing 10% FBS were used as a positive control (“G”, blue bars). Serum-starved cells were used as a negative control (“S”, red bars). These data represent the average of three experiments performed in triplicate. *p<0.05. (B) SKOV-3 cells were serum-starved overnight, then one group was exposed to complete medium containing 10% FBS, second group was serum-starved, and the third group was treated with 25 nM CX3CL1 in serum-free medium for 24 h, and photographed using a Zeiss microscope with a 5× objective. Bar, 100 μm. Nuclear PCNA staining (green) was evaluated by immunofluorescence. Nuclei were stained with DAPI (blue). Fluorescent images were generated using a Zeiss AxioObserver fluorescent microscope with a 40× objective. Images were collected independently on the green and blue filters and subsequently superimposed. Bar, 20 μm. (C) SKOV-3 cells that were not transfected, transfected with control, CX3CR1-specific, or EGFR-specific siRNAs were subjected to the cell proliferation assay in the presence of 25 nM CX3CL1 (“S + 25 nM CX3CL1 Growth phase cells cultured in complete media containing 10% FBS were used as a positive control (“G”, blue bars). Serum-starved cells were used as a negative control (“S”, red bars). Data represent the average of three experiments performed in triplicate. *p<0.05. Expression of CX3CR1 and EGFR in transfected and non-transfected SKOV-3 cells was determined by Western blot. GAPDH served as a loading control. THP-1 and A431 cell lysates were used as positive controls for expression of CX3CR1 and EGFR, respectively. Histograms demonstrate the levels of CX3CR1 and EGFR expression, as determined by digital densitometry. *p<0.05.

References

    1. Jemal A, Siegel R, Xu J, Ward E. Cancer statistics. CA Cancer J Clin. 2010;60:277–300. - PubMed
    1. Cannistra SA. Cancer of the ovary. N Engl J Med. 2004;351:2519–29. - PubMed
    1. Armstrong DK, Bundy B, Wenzel L, et al. Intraperitoneal cisplatin and paclitaxel in ovarian cancer. N Engl J Med. 2006;354:34–43. - PubMed
    1. Martin LP, Schilder RJ. Management of recurrent ovarian carcinoma: current status and future directions. Semin Oncol. 2009;36:112–25. - PubMed
    1. Vasey PA. Management of recurrent epithelial ovarian carcinoma. Aust N Z J Obstet Gynaecol. 2005;45:269–77. - PubMed

Publication types

MeSH terms