. 2012 Jan;40(1):e6.
doi: 10.1093/nar/gkr928. Epub 2011 Nov 7.

Detection of recombination events in bacterial genomes from large population samples

Affiliations

Detection of recombination events in bacterial genomes from large population samples

Pekka Marttinen et al. Nucleic Acids Res. 2012 Jan.

Abstract

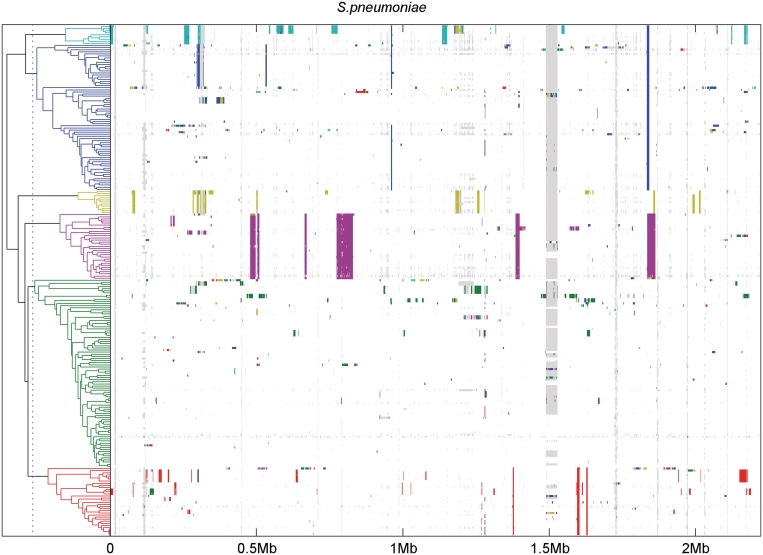
Analysis of important human pathogen populations is currently under transition toward whole-genome sequencing of growing numbers of samples collected on a global scale. Since recombination in bacteria is often an important factor shaping their evolution by enabling resistance elements and virulence traits to rapidly transfer from one evolutionary lineage to another, it is highly beneficial to have access to tools that can detect recombination events. Multiple advanced statistical methods exist for such purposes; however, they are typically limited either to only a few samples or to data from relatively short regions of a total genome. By harnessing the power of recent advances in Bayesian modeling techniques, we introduce here a method for detecting homologous recombination events from whole-genome sequence data for bacterial population samples on a large scale. Our statistical approach can efficiently handle hundreds of whole genome sequenced population samples and identify separate origins of the recombinant sequence, offering an enhanced insight into the diversification of bacterial clones at the level of the whole genome. A data set of 241 whole genome sequences from an important pandemic lineage of Streptococcus pneumoniae is used together with multiple simulated data sets to demonstrate the potential of our approach.


Figures

Figure 1.
Figure 1.
Illustration of HMM transition probabilities. The figure presents an example of the transition distributions of the hidden Markov model underlying our modeling approach. In this example, the number of possible states (or clusters), K, is equal to 4, and sj−1 and sj represent states of the chain at two consecutive bases. The topmost state denoted by a square represents the non-recombinant state. The other three states denoted by filled circles represent possible recombinant states. The panel on the left shows possible transitions from the non-recombinant state. The panel on the right shows corresponding transitions from a single recombinant state. These transition probabilities are similar for all recombinant states. The meanings of the parameters are explained in detail in the text.
Figure 2.
Figure 2.
Simulated phylogenetic tree. The figure shows the phylogenetic tree used for generating the simulated sequences. Depending on the simulation setup, the height of the tree, d, was selected to be either 0.01 or 0.03 in units of substitutions per site (see Table 2). The cyan-colored taxa correspond to the sampled data and they are assigned some number of recombination events from sequences of taxa present in other branches. The smaller panel zooms in to the structure of the cyan-colored branch.
Figure 3.
Figure 3.
Simulated data, 250 recombinations. The figure shows the results of the analysis of a simulated data set with 250 recombination events corresponding to row 3 in Table 2. The y-axis represents our simulated sampled taxa, and the x-axis the position along the genome. The taxa are ordered such that the first (lowest) taxon is the first one from left in Figure 2. The panel on top shows the true recombination events in the simulated sequences. The panel at the bottom shows significantly detected recombinations. For illustration purposes, the detected segments are colored using the color of the true origin within the segment. If a detected segment overlaps more than one true segment, the color is arbitrarily selected between the alternative colors. If a detected segment is false positive (i.e. does not overlap with any true recombined segment), it is colored black.
Figure 4.
Figure 4.
Results of recombination analysis for S. pneumoniae data. The figure shows the results of our analysis of 241 S. pneumoniae isolates. On the left, the PSA tree is shown. The tree is cut at threshold level 0.25 to produce 6 clusters, colored as blue, green, red, cyan, magenta and yellow, respectively. Summary information about the cluster contents is given in Table 3, while more detailed information about the samples is provided in the Supplementary Table S3. On the right, a horizontal colored bar showing the indicated recombination events is displayed for each sample. The colors of the detected segments indicate the cluster in which the segment is most prevalent. Gray color is used to show missing SNPs.
Figure 5.
Figure 5.
Maximum likelihood phylogenetic trees for S. pneumoniae data. (a) and (b) show the maximum likelihood phylogenetic trees for S. pneumoniae data, constructed using either all data or polymorphisms outside any inferred recombination events, respectively (28). Both trees are drawn as unrooted. The clustering obtained from our analysis using the PSA tree in Figure 4 is indicated in the trees by coloring the leaf nodes using the same cluster specific colors as in Figure 4.
Figure 6.
Figure 6.
Detailed results for the cps locus. The panel on top shows results from our analysis of the S. pneumoniae data set zoomed in to sequence positions 0.29–0.33 Mb comprising the cps locus. The isolates which have undergone serotype switching have been marked on the right of the panel. The clustering of the samples at two specific SNP positions indicated by vertical dotted lines in the plot is given in Supplementary Table S3. The wchA gene discussed in the text is located below the rightmost dotted line. The panel at the bottom shows a maximum likelihood phylogeny for the region containing the wchA gene (see text for details).

References

    1. Majewski J. Sexual isolation in bacteria. FEMS Microbiol. Lett. 2001;199:161–169. - PubMed
    1. Fraser C, Hanage W, Spratt B. Recombination and the nature of bacterial speciation. Science. 2007;315:476–480. - PMC - PubMed
    1. Jain R, Rivera M, Moore J, Lake J. Horizontal gene transfer in microbial genome evolution. Theor. Popul. Biol. 2002;61:489–495. - PubMed
    1. Lawrence J. Gene transfer in bacteria: speciation without species? Theor. Popul. Biol. 2002;61:449–460. - PubMed
    1. Hanage W, Fraser C, Spratt B. Fuzzy species among recombinogenic bacteria. BMC Biol. 2005;3:6. - PMC - PubMed

Publication types