. 2011 Oct 28:5:69.
doi: 10.3389/fnbeh.2011.00069. eCollection 2011.

Representation of non-spatial and spatial information in the lateral entorhinal cortex

Affiliations

Representation of non-spatial and spatial information in the lateral entorhinal cortex

Sachin S Deshmukh et al. Front Behav Neurosci. .

Abstract

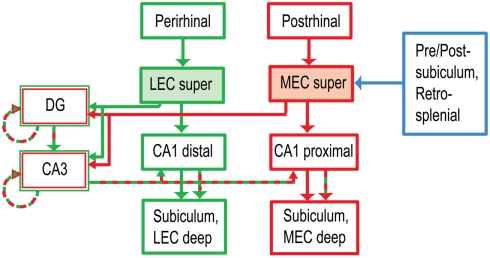
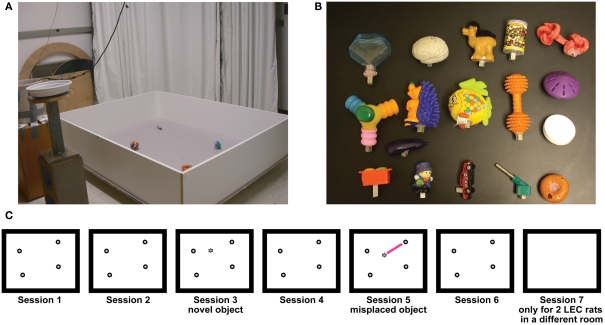
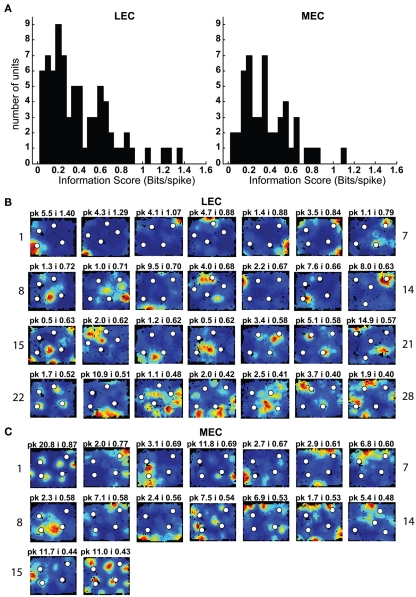
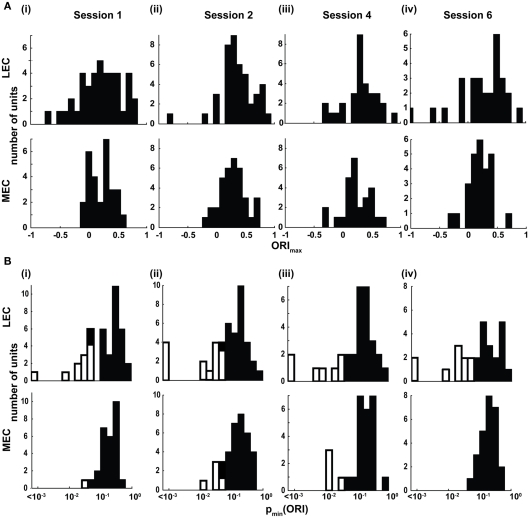
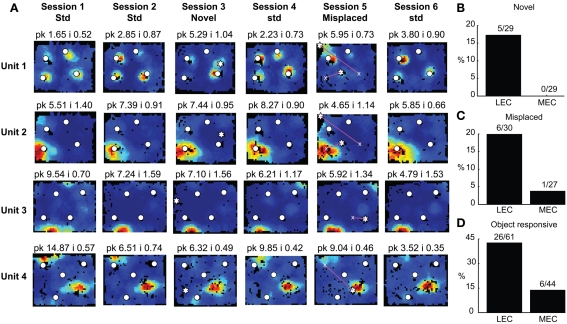
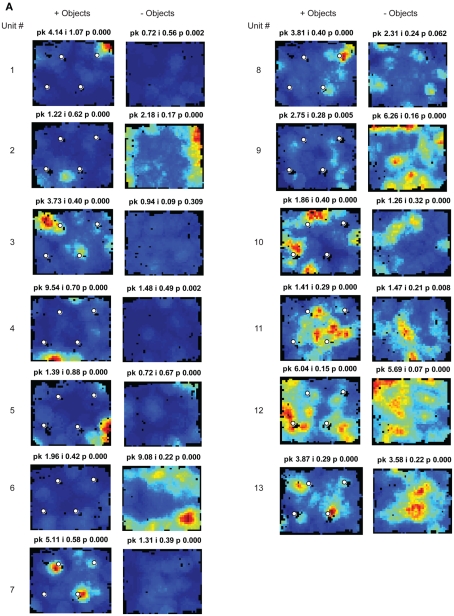
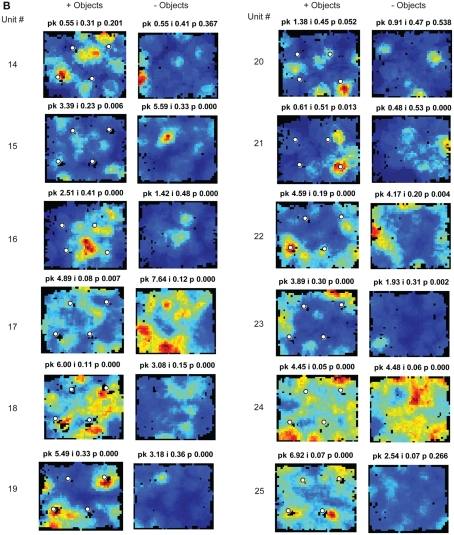
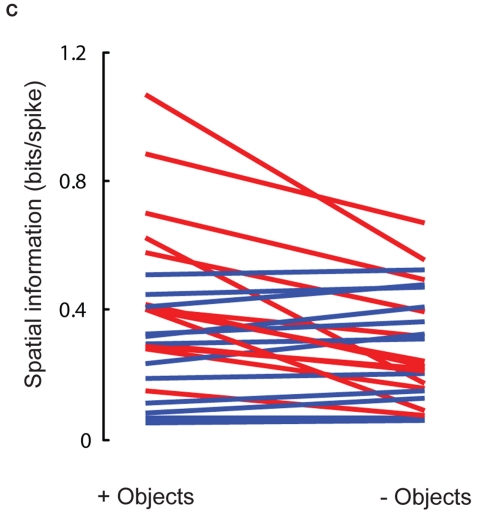
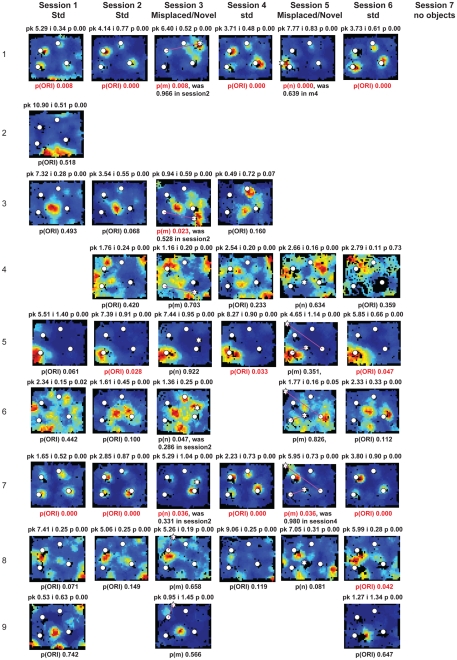
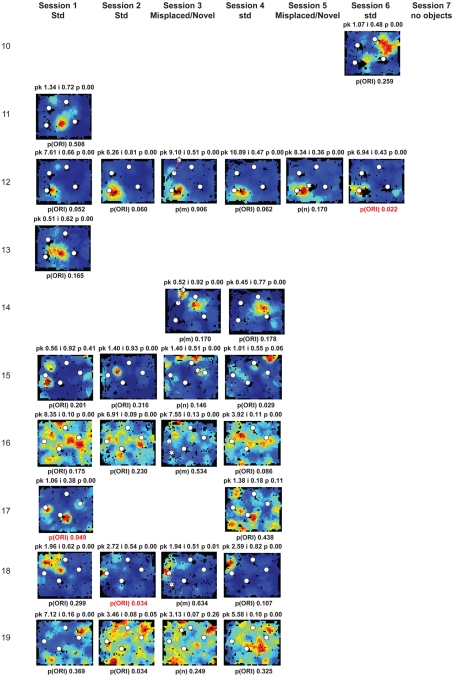
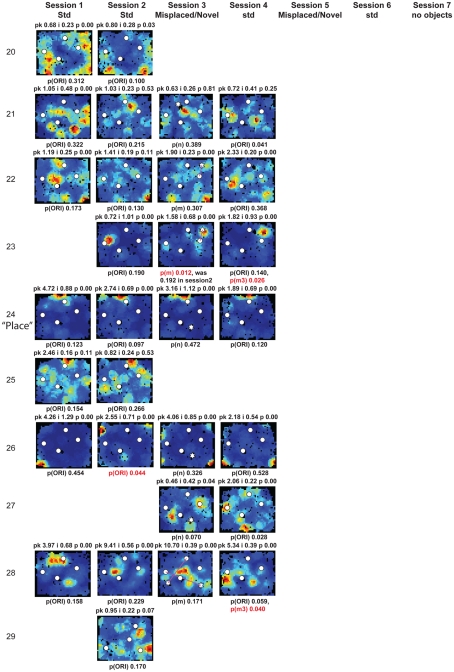
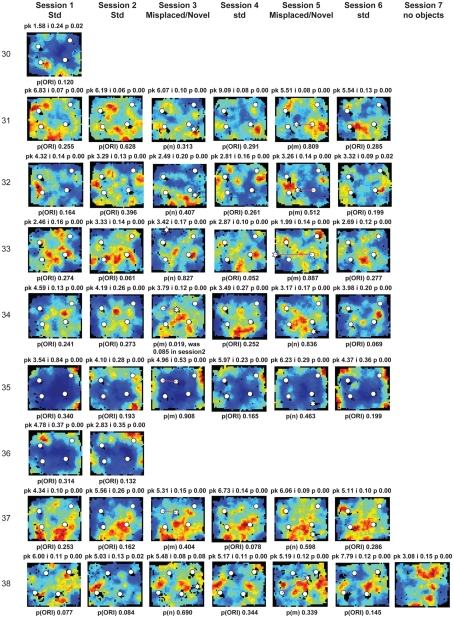
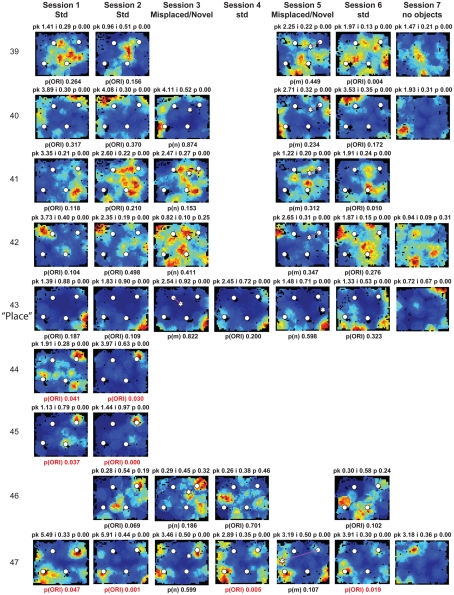
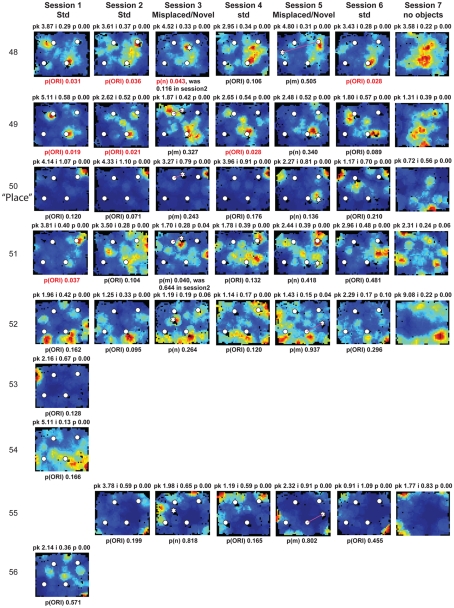
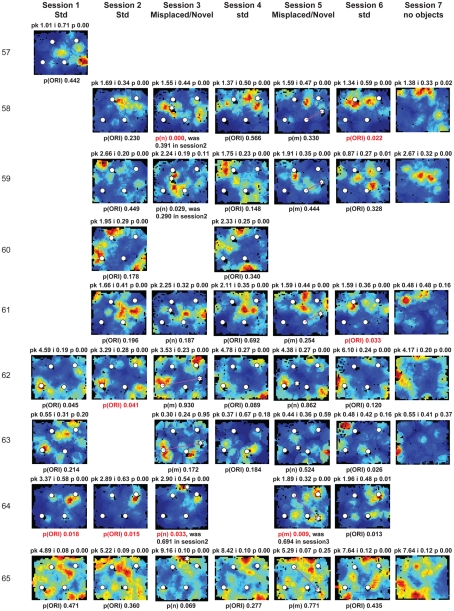
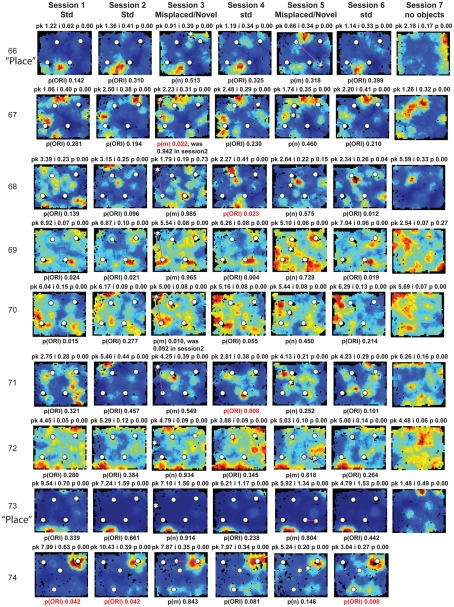
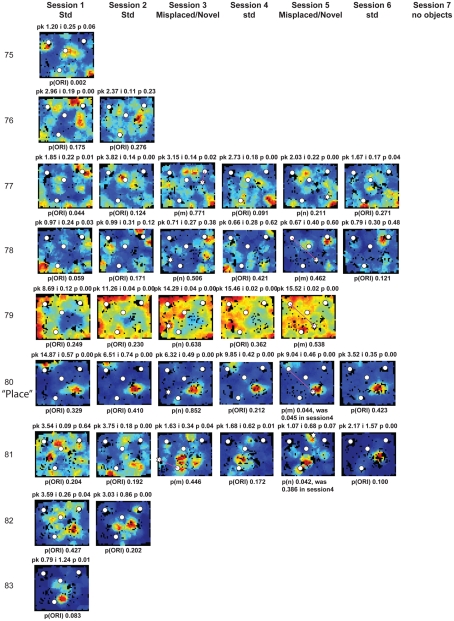
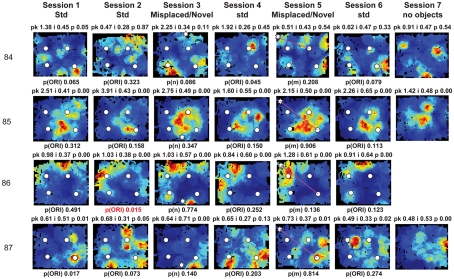
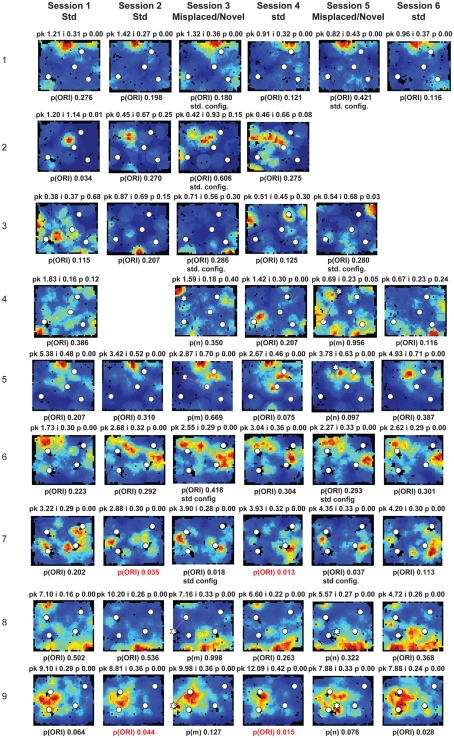
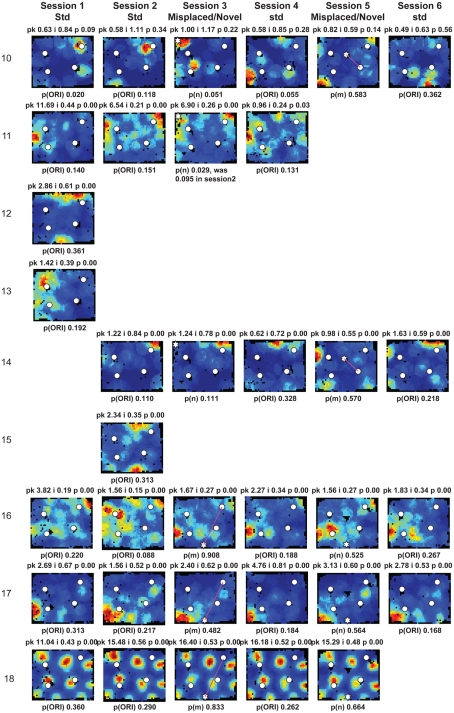
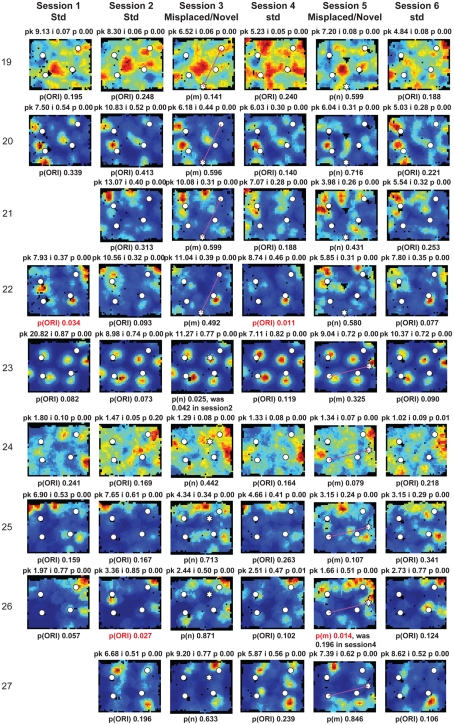
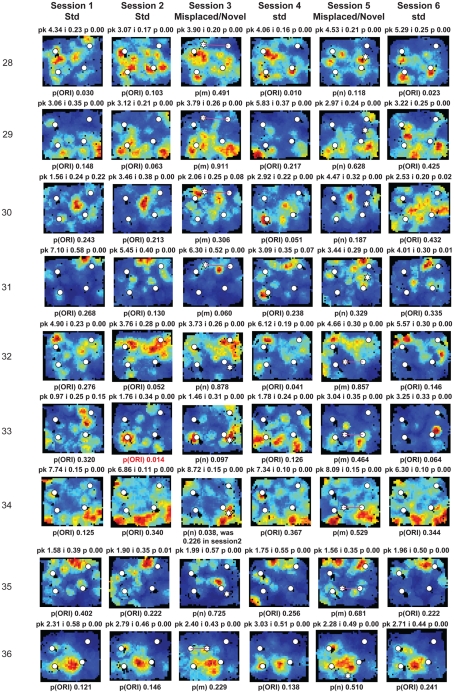
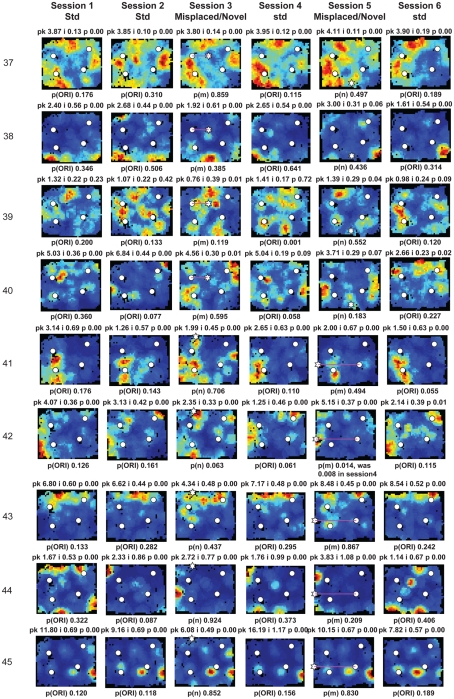
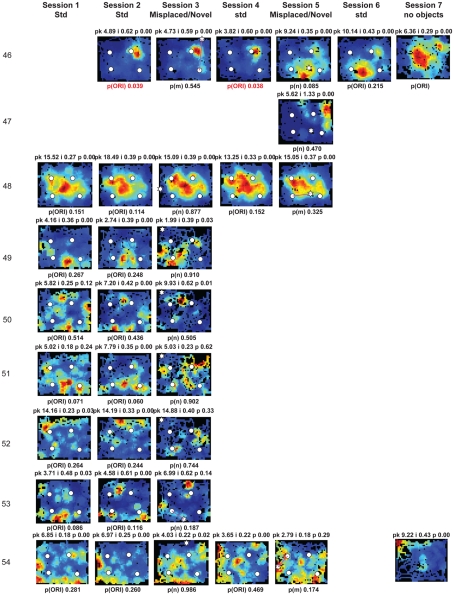
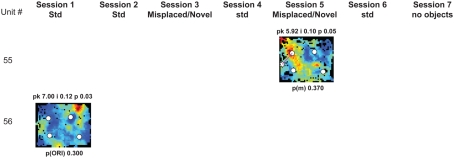
Some theories of memory propose that the hippocampus integrates the individual items and events of experience within a contextual or spatial framework. The hippocampus receives cortical input from two major pathways: the medial entorhinal cortex (MEC) and the lateral entorhinal cortex (LEC). During exploration in an open field, the firing fields of MEC grid cells form a periodically repeating, triangular array. In contrast, LEC neurons show little spatial selectivity, and it has been proposed that the LEC may provide non-spatial input to the hippocampus. Here, we recorded MEC and LEC neurons while rats explored an open field that contained discrete objects. LEC cells fired selectively at locations relative to the objects, whereas MEC cells were weakly influenced by the objects. These results provide the first direct demonstration of a double dissociation between LEC and MEC inputs to the hippocampus under conditions of exploration typically used to study hippocampal place cells.

Keywords: grid cells; hippocampus; medial entorhinal cortex; memory; navigation; objects.


Figures

Figure 1
Figure 1
Anatomical segregation of cortical inputs to hippocampus (Burwell, ; Witter and Amaral, 2004). The LEC receives major input from the perirhinal cortex, part of the brain’s ventral (“what”) pathway. The MEC receives input from the postrhinal (parahippocampal) cortex, part of the dorsal (“where”) pathway. The MEC also receives major spatial inputs from the presubiculum, postsubiculum, and retrosplenial cortex, all of which show stronger spatial tuning than the postrhinal cortex (Knierim, 2006). The projections of LEC and MEC to CA1 remain segregated along the transverse (proximal–distal) axis of the hippocampus, whereas the projections to the DG and CA3 converge onto the same anatomical regions. (For simplicity, a number of anatomical connections have been excluded from this diagram. super: superficial layers II and III, the inputs to the hippocampus. deep: deep layers V and VI, which receive feedback from the hippocampus.)
Figure 2
Figure 2
Experimental protocol. (A) Recording environment. (B) Representative objects used in the experiments. (C) Typical experimental protocol. Rats foraged for chocolate sprinkles for 15 min each in six consecutive sessions in the presence of objects. Sessions 3 and 5 were object-manipulation sessions in which either a novel object was introduced (session 3, here) or one of the objects was misplaced (session 5 here); the type of object-manipulation was counterbalanced between sessions 3 and 5 across days. Session 7, in which rats explored a box in a different room with no objects, was run in only the last two rats.
Figure 3
Figure 3
Spatial information scores in LEC are comparable to those in MEC in the presence of objects. (A) Distributions of spatial information scores in LEC and MEC in session 1 with objects in their standard configuration. (B,C) Firing rate maps of LEC (B) and MEC (C) neurons with statistically significant (p < 0.01) spatial information scores greater than 0.4 bits/spike in the first session. White circles mark locations of objects. Blue corresponds to no firing while red corresponds to the peak firing rate. Numbers at the top of each rate map indicate peak firing rate (pk) in Hz and spatial information score (i) in bits/spike. Numbers at the left and right of the figure indicate unit numbers.
Figure 4
Figure 4
Lateral entorhinal cortex (LEC) neurons display higher object-responsiveness than MEC neurons. (A) Distribution of the ORImax of LEC (top) and MEC (bottom) neurons in the four standard sessions. (B) Distribution of the pmin(ORI). White bars indicate cells that showed statistically significant (p < 0.05) object-related firing. LEC showed a significantly larger proportion of neurons with object-related firing in three of the four standard sessions compared to MEC (session 1 LEC:11/41, MEC:1/28, χ2 = 4.75, one tailed p = 0.0148; session 2 LEC:14/43, MEC:5/36, χ2 = 3.74, one tailed p = 0.027; session 4 LEC: 7/31, MEC: 4/27, χ2 = 0.174, one tailed p = 0.308, n.s.; session 6 LEC 10/28, MEC 0/26, χ2 = 9.15, one tailed p = 0.0015).
Figure 5
Figure 5
Responses of entorhinal cortical neurons to object manipulations. (A) Object-responsive (units 1–2) and spatially selective (units 3–4) neurons in LEC. White circles mark the standard locations of objects and stars represent the locations of novel (session 3) and misplaced (session 5) objects. Magenta lines connect the standard (marked by x) and misplaced locations of objects in session 5. The firing of units 3 and 4 did not depend on the animals’ head direction being pointed toward the objects. (B) A significantly larger proportion of LEC neurons respond to novel objects. (C) A similar trend is seen in response to misplaced objects. (D) A significantly larger proportion of LEC neurons shows object-related activity in at least one session.
Figure 6
Figure 6
Single unit recording locations. The locations of units recorded from all rats are marked on coronal sections from one of the rats used in this study. Red dots indicate the locations of units with pmin(ORI) < 0.05 shown in Figures A2 and A3 in Appendix. Green dots indicate the locations of LEC putative place cells firing away from objects shown in Figure A2 in Appendix. Blue dots show the locations of unclassified units. These sections are 470 μm apart (assuming a 15% histological shrinkage factor), and approximately correspond to the following plates in the Paxinos and Watson (1998) rat brain atlas: section 1: plate 42 (bregma −5.6 mm) to section 10: plate 55 (bregma −8.8 mm). Scale bar is 1 mm.
Figure A1
Figure A1
Spatial information in LEC is higher in an open field containing objects compared to an empty field. To test whether the higher spatial information recorded with objects in the present study, compared to previous studies (Hargreaves et al., ; Yoganarasimha et al., 2010), was an artifact of uncontrolled differences between the studies, 25 LEC units in two rats were recorded in sessions with (session 1) and without (session 7) objects. Because the LEC firing patterns might have been affected by a prior history of the presence of objects, the session without objects was conducted in a similar box in a different room to minimize such a confound. (A) Firing rate maps of the neurons with higher spatial information scores in the presence of objects than in the absence of objects, sorted in decreasing order of the difference. Note that a number of cells (units 1, 3, 4, 5, 7, and 8) had highly localized, high-rate firing fields in the presence of objects but weaker, more diffuse firing in the absence of objects. Two cells (units 2 and 6) fired at higher rates in the session without objects, but they fired along multiple walls, not in restricted locations. Similar activity along walls has been shown previously (Hargreaves et al., 2005). Peak firing rate (pk, Hz), spatial information score (i, bits/spike) and probability of getting the information score by chance (p) are shown at the top of each plot. Unlike the firing rate maps shown elsewhere in the paper, which were autoscaled between 0 Hz and maximum firing rates within the individual rate maps, the firing rate maps in (A,B) were scaled such that blue corresponds to 0 Hz while red corresponds to the larger of the peak firing rates in the with- and without-object sessions for the given neuron. This cross-session scaling makes it easy to see rate remapping as well as the locations of firing fields. Note that in some cases, the scaling masks low-rate firing that still results in moderate spatial information scores (e.g., units 1 and 4 without objects show information scores of 0.56 and 0.49, respectively, although the peak firing rates and information scores are less than they are with objects). (B) Firing rate maps of the neurons with lower spatial information scores in the presence of objects than in the absence of objects, sorted in decreasing order of the difference. Note the lack of a pronounced difference in spatial firing selectivity between the with-object and without-object sessions in these cells, in contrast with the numerous examples in (A). This contrast argues strongly against a generalized “remapping” interpretation of these data, as such an explanation would predict the number of cells having higher spatial information in the with-objects session to be approximately equal to the number of cells having higher information score in the without-objects environments. On average, the firing rate maps without objects in (A,B) resemble those shown in prior reports of LEC non-spatial firing (Hargreaves et al., ; Yoganarasimha et al., 2010), with none of the cells showing robust, highly localized firing, indicating that the increased responsiveness when objects are present is not due to a generalized increase in spatial selectivity in the present study. Both rats included in this analysis were trained extensively in the environment with objects, and the last 2–3 days of training included one foraging session in the environment without objects. The experiments were run over multiple days, making the second room more familiar over time. Furthermore, because the prior studies recorded from highly familiar environments and showed poor spatial selectivity in LEC, the similar lack of spatial selectivity without objects in the present study is unlikely a result of the relative novelty of the environment without objects. (C) Comparison of spatial information scores of LEC neurons in the presence and absence of objects. Red lines connect spatial information scores in the presence (+) and in the absence (−) of objects for neurons that showed higher spatial information scores in the presence of objects than in the absence of objects, shown in (A). Blue lines connect spatial information scores for neurons that showed lower spatial information in the presence of objects than in the absence of objects, shown in (B). Visually, the slopes of the red lines are on average greater than the slopes of the blue lines, indicating that a number of cells that had high spatial information in the presence of objects lost this tuning in the absence of objects. There were no neurons that had high spatial information in the absence of objects and much lower information in the presence of objects (i.e., there are no blue lines with a steep slope), arguing against a general remapping explanation for differences between the environments. Across all neurons, the spatial information scores were significantly higher in the presence of objects than in the absence of objects (with-objects median = 0.33 bits/spike, without-objects median = 0.24 bits/spike; Wilcoxon signed rank test, p = 0.04).This difference was even more significant when only the 23 cells with significant information scores (p < 0.01) in at least one of the two sessions were included (with-objects median = 0.33 bits/spike, without-objects median = 0.22 bits/spike; Wilcoxon signed rank test, p = 0.017).
Figure A1
Figure A1
Spatial information in LEC is higher in an open field containing objects compared to an empty field. To test whether the higher spatial information recorded with objects in the present study, compared to previous studies (Hargreaves et al., ; Yoganarasimha et al., 2010), was an artifact of uncontrolled differences between the studies, 25 LEC units in two rats were recorded in sessions with (session 1) and without (session 7) objects. Because the LEC firing patterns might have been affected by a prior history of the presence of objects, the session without objects was conducted in a similar box in a different room to minimize such a confound. (A) Firing rate maps of the neurons with higher spatial information scores in the presence of objects than in the absence of objects, sorted in decreasing order of the difference. Note that a number of cells (units 1, 3, 4, 5, 7, and 8) had highly localized, high-rate firing fields in the presence of objects but weaker, more diffuse firing in the absence of objects. Two cells (units 2 and 6) fired at higher rates in the session without objects, but they fired along multiple walls, not in restricted locations. Similar activity along walls has been shown previously (Hargreaves et al., 2005). Peak firing rate (pk, Hz), spatial information score (i, bits/spike) and probability of getting the information score by chance (p) are shown at the top of each plot. Unlike the firing rate maps shown elsewhere in the paper, which were autoscaled between 0 Hz and maximum firing rates within the individual rate maps, the firing rate maps in (A,B) were scaled such that blue corresponds to 0 Hz while red corresponds to the larger of the peak firing rates in the with- and without-object sessions for the given neuron. This cross-session scaling makes it easy to see rate remapping as well as the locations of firing fields. Note that in some cases, the scaling masks low-rate firing that still results in moderate spatial information scores (e.g., units 1 and 4 without objects show information scores of 0.56 and 0.49, respectively, although the peak firing rates and information scores are less than they are with objects). (B) Firing rate maps of the neurons with lower spatial information scores in the presence of objects than in the absence of objects, sorted in decreasing order of the difference. Note the lack of a pronounced difference in spatial firing selectivity between the with-object and without-object sessions in these cells, in contrast with the numerous examples in (A). This contrast argues strongly against a generalized “remapping” interpretation of these data, as such an explanation would predict the number of cells having higher spatial information in the with-objects session to be approximately equal to the number of cells having higher information score in the without-objects environments. On average, the firing rate maps without objects in (A,B) resemble those shown in prior reports of LEC non-spatial firing (Hargreaves et al., ; Yoganarasimha et al., 2010), with none of the cells showing robust, highly localized firing, indicating that the increased responsiveness when objects are present is not due to a generalized increase in spatial selectivity in the present study. Both rats included in this analysis were trained extensively in the environment with objects, and the last 2–3 days of training included one foraging session in the environment without objects. The experiments were run over multiple days, making the second room more familiar over time. Furthermore, because the prior studies recorded from highly familiar environments and showed poor spatial selectivity in LEC, the similar lack of spatial selectivity without objects in the present study is unlikely a result of the relative novelty of the environment without objects. (C) Comparison of spatial information scores of LEC neurons in the presence and absence of objects. Red lines connect spatial information scores in the presence (+) and in the absence (−) of objects for neurons that showed higher spatial information scores in the presence of objects than in the absence of objects, shown in (A). Blue lines connect spatial information scores for neurons that showed lower spatial information in the presence of objects than in the absence of objects, shown in (B). Visually, the slopes of the red lines are on average greater than the slopes of the blue lines, indicating that a number of cells that had high spatial information in the presence of objects lost this tuning in the absence of objects. There were no neurons that had high spatial information in the absence of objects and much lower information in the presence of objects (i.e., there are no blue lines with a steep slope), arguing against a general remapping explanation for differences between the environments. Across all neurons, the spatial information scores were significantly higher in the presence of objects than in the absence of objects (with-objects median = 0.33 bits/spike, without-objects median = 0.24 bits/spike; Wilcoxon signed rank test, p = 0.04).This difference was even more significant when only the 23 cells with significant information scores (p < 0.01) in at least one of the two sessions were included (with-objects median = 0.33 bits/spike, without-objects median = 0.22 bits/spike; Wilcoxon signed rank test, p = 0.017).
Figure A2
Figure A2
Rate maps of all well-isolated neurons recorded from LEC with >50 spikes in the given session. All rate maps shown were smoothed using adaptive binning (Skaggs et al., 1996), but unsmoothed rate maps were used for the analyses of object-responsiveness. The positions of familiar objects in their standard locations are marked with white circles, while misplaced and novel objects (in sessions 3/5) are marked with stars. Magenta lines connect the standard and new locations of misplaced objects. The peak firing rate (pk, spikes/second), spatial information score (i, bits/spike), and probability of obtaining the information score by chance (p) are shown at the top of each rate map. For standard object sessions (sessions 1, 2, 4, and 6), pmin (ORI) is shown at the bottom of each rate map [marked as p(ORI)]. For novel or misplaced object sessions (sessions 3 and 5), the probability of getting higher firing at the novel [p(n)] or misplaced [p(m)] object is shown. Font colors for these probabilities are red when they are <0.05 and when the rate maps have a spatial information score >0.25 bits/spike that is statistically significant at the p < 0.01 level. These are the neurons included in the χ2 statistics reported in the paper. While many LEC neurons showing object-related firing showed a lot of session to session variability in terms of firing rates as well as the subsets of objects they fired at (e.g., units 1, 7, 23, 48, 58, 71, and 86), some neurons repeatedly fired at the same subset of objects over multiple sessions (e.g., units 5, 12, 45, 47, 49, 64, and 74). Thus, a subset of LEC neurons may convey information about object identity in a distributed, population code. A number of LEC cells were identified as putative place cells, using the conservative criteria of a high spatial information score >0.4 bits/spike, high session to session stability, and a low probability of object-related activity (see Materials and Methods). These neurons are marked to the left of session 1 with a “Place” label (units 24, 43, 50, 66, 73, 80). There are other putative place cells visible, which might have failed on one on more criteria, but which show distinct firing fields away from the objects (e.g., units 2, 3, 9, 11, 53). Units 5 and 74, which fire at single objects, may also be place-related. This interpretation is supported by the continued firing of these neurons in the same locations when the objects were moved to different locations. Three LEC neurons (units 3, 23, 28) show object–place conjunctive responses. Unit 3 fires at a misplaced object in session 3. It does not fire at this object in the other three sessions when the object is in its standard position. Unit 23 fires at the misplace location of an object (and weakly at the position where it used to be) in session 3. It continues firing at this new location when the object is moved back to its standard location. It does not fire at the object in sessions 2 and 4, when the object is in its standard position. Unit 28 fires at the misplaced locations of objects in session 3 [although p(m) is greater than 0.05] and continues to fire at the new locations in session 4, after the objects have been moved back to their standard positions. All these responses cannot be explained as purely object-related or purely space-related activity, but are correlated to object and space. Similar activity has previously been shown in hippocampus (O’Keefe, 1976) and cingulate cortex (Weible et al., 2009). In addition to the probabilities shown with ratemaps for all other neurons, ratemaps for units 23 and 28 also show p(m3), which is the probability in session 4 that the ORI at the misplaced location (where the object used to be in session 3) can be obtained by chance. A variety of considerations led to the exclusion of some of the neurons recorded in some of the sessions from the analyses. If a cell fired less than 50 spikes in a given session, or showed a drop in waveform signal-to-noise in a given session so as to make its isolation quality unacceptable, the cell was eliminated from the analysis, and its rate map not shown here. In addition, sessions in which the rat foraged poorly were excluded. All the decisions about excluding cells/sessions were made without regard to spatial firing characteristics of the neurons in the given session. Behavioral biases of the rats (e.g., their tendency to run counter clockwise along the periphery, and approach objects in a stereotyped manner on the way in from the periphery) lead to unoccupied pixels near objects seen in many of the rate maps, especially in the sessions that the rats did not forage very well. These pixels often tend to be on the southwest side of the objects. Object-related calculations were performed only if there were at least 15 occupied pixels within a 5-pixel radius of the given object in a particular session. The reasons for the behavioral bias are not known, but because this bias was common to the rats with LEC as well as MEC recordings, it should not affect the comparison of spatial information as well as object-related activity between the two areas. The behavioral correlates of the rats’ interactions with the objects, beyond the purview of the current study, will shed light on the nature of object-related activity seen here.
Figure A2
Figure A2
Rate maps of all well-isolated neurons recorded from LEC with >50 spikes in the given session. All rate maps shown were smoothed using adaptive binning (Skaggs et al., 1996), but unsmoothed rate maps were used for the analyses of object-responsiveness. The positions of familiar objects in their standard locations are marked with white circles, while misplaced and novel objects (in sessions 3/5) are marked with stars. Magenta lines connect the standard and new locations of misplaced objects. The peak firing rate (pk, spikes/second), spatial information score (i, bits/spike), and probability of obtaining the information score by chance (p) are shown at the top of each rate map. For standard object sessions (sessions 1, 2, 4, and 6), pmin (ORI) is shown at the bottom of each rate map [marked as p(ORI)]. For novel or misplaced object sessions (sessions 3 and 5), the probability of getting higher firing at the novel [p(n)] or misplaced [p(m)] object is shown. Font colors for these probabilities are red when they are <0.05 and when the rate maps have a spatial information score >0.25 bits/spike that is statistically significant at the p < 0.01 level. These are the neurons included in the χ2 statistics reported in the paper. While many LEC neurons showing object-related firing showed a lot of session to session variability in terms of firing rates as well as the subsets of objects they fired at (e.g., units 1, 7, 23, 48, 58, 71, and 86), some neurons repeatedly fired at the same subset of objects over multiple sessions (e.g., units 5, 12, 45, 47, 49, 64, and 74). Thus, a subset of LEC neurons may convey information about object identity in a distributed, population code. A number of LEC cells were identified as putative place cells, using the conservative criteria of a high spatial information score >0.4 bits/spike, high session to session stability, and a low probability of object-related activity (see Materials and Methods). These neurons are marked to the left of session 1 with a “Place” label (units 24, 43, 50, 66, 73, 80). There are other putative place cells visible, which might have failed on one on more criteria, but which show distinct firing fields away from the objects (e.g., units 2, 3, 9, 11, 53). Units 5 and 74, which fire at single objects, may also be place-related. This interpretation is supported by the continued firing of these neurons in the same locations when the objects were moved to different locations. Three LEC neurons (units 3, 23, 28) show object–place conjunctive responses. Unit 3 fires at a misplaced object in session 3. It does not fire at this object in the other three sessions when the object is in its standard position. Unit 23 fires at the misplace location of an object (and weakly at the position where it used to be) in session 3. It continues firing at this new location when the object is moved back to its standard location. It does not fire at the object in sessions 2 and 4, when the object is in its standard position. Unit 28 fires at the misplaced locations of objects in session 3 [although p(m) is greater than 0.05] and continues to fire at the new locations in session 4, after the objects have been moved back to their standard positions. All these responses cannot be explained as purely object-related or purely space-related activity, but are correlated to object and space. Similar activity has previously been shown in hippocampus (O’Keefe, 1976) and cingulate cortex (Weible et al., 2009). In addition to the probabilities shown with ratemaps for all other neurons, ratemaps for units 23 and 28 also show p(m3), which is the probability in session 4 that the ORI at the misplaced location (where the object used to be in session 3) can be obtained by chance. A variety of considerations led to the exclusion of some of the neurons recorded in some of the sessions from the analyses. If a cell fired less than 50 spikes in a given session, or showed a drop in waveform signal-to-noise in a given session so as to make its isolation quality unacceptable, the cell was eliminated from the analysis, and its rate map not shown here. In addition, sessions in which the rat foraged poorly were excluded. All the decisions about excluding cells/sessions were made without regard to spatial firing characteristics of the neurons in the given session. Behavioral biases of the rats (e.g., their tendency to run counter clockwise along the periphery, and approach objects in a stereotyped manner on the way in from the periphery) lead to unoccupied pixels near objects seen in many of the rate maps, especially in the sessions that the rats did not forage very well. These pixels often tend to be on the southwest side of the objects. Object-related calculations were performed only if there were at least 15 occupied pixels within a 5-pixel radius of the given object in a particular session. The reasons for the behavioral bias are not known, but because this bias was common to the rats with LEC as well as MEC recordings, it should not affect the comparison of spatial information as well as object-related activity between the two areas. The behavioral correlates of the rats’ interactions with the objects, beyond the purview of the current study, will shed light on the nature of object-related activity seen here.
Figure A3
Figure A3
Rate maps of all well-isolated neurons recorded from MEC with >50 spikes in the given session. See Figure A2 caption for details.
Figure A3
Figure A3
Rate maps of all well-isolated neurons recorded from MEC with >50 spikes in the given session. See Figure A2 caption for details.
Figure A3
Figure A3
Rate maps of all well-isolated neurons recorded from MEC with >50 spikes in the given session. See Figure A2 caption for details.
Figure A3
Figure A3
Rate maps of all well-isolated neurons recorded from MEC with >50 spikes in the given session. See Figure A2 caption for details.
Figure A3
Figure A3
Rate maps of all well-isolated neurons recorded from MEC with >50 spikes in the given session. See Figure A2 caption for details.
Figure A3
Figure A3
Rate maps of all well-isolated neurons recorded from MEC with >50 spikes in the given session. See Figure A2 caption for details.
Figure A3
Figure A3
Rate maps of all well-isolated neurons recorded from MEC with >50 spikes in the given session. See Figure A2 caption for details.

References

    1. Aggleton J. P., Brown M. W. (1999). Episodic memory, amnesia, and the hippocampal-anterior thalamic axis. Behav. Brain Sci. 22, 425–44410.1017/S0140525X99002034 - DOI - PubMed
    1. Boccara C. N., Sargolini F., Thoresen V. H., Solstad T., Witter M. P., Moser E. I., Moser M. B. (2010). Grid cells in pre- and parasubiculum. Nat. Neurosci. 13, 987–99410.1038/nn.2602 - DOI - PubMed
    1. Brandon M. P., Bogaard A. R., Libby C. P., Connerney M. A., Gupta K., Hasselmo M. E. (2011). Reduction of theta rhythm dissociates grid cell spatial periodicity from directional tuning. Science 332, 595–59910.1126/science.1201652 - DOI - PMC - PubMed
    1. Burwell R. D. (2000). The parahippocampal region: corticocortical connectivity. Ann. N. Y. Acad. Sci. 911, 25–4210.1111/j.1749-6632.2000.tb06717.x - DOI - PubMed
    1. Chen L. L., Lin L. H., Green E. J., Barnes C. A., McNaughton B. L. (1994). Head-direction cells in the rat posterior cortex. I. Anatomical distribution and behavioral modulation. Exp. Brain Res. 101, 8–2310.1007/BF00243213 - DOI - PubMed

LinkOut - more resources