. 2011 Nov 21;208(12):2357-66.
doi: 10.1084/jem.20111171. Epub 2011 Nov 7.

Synthetic double-stranded RNA induces innate immune responses similar to a live viral vaccine in humans

Affiliations

Synthetic double-stranded RNA induces innate immune responses similar to a live viral vaccine in humans

Marina Caskey et al. J Exp Med. .

Abstract

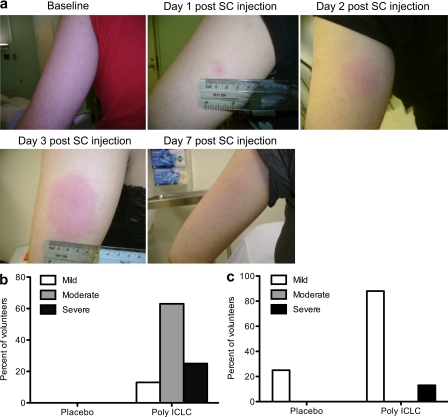
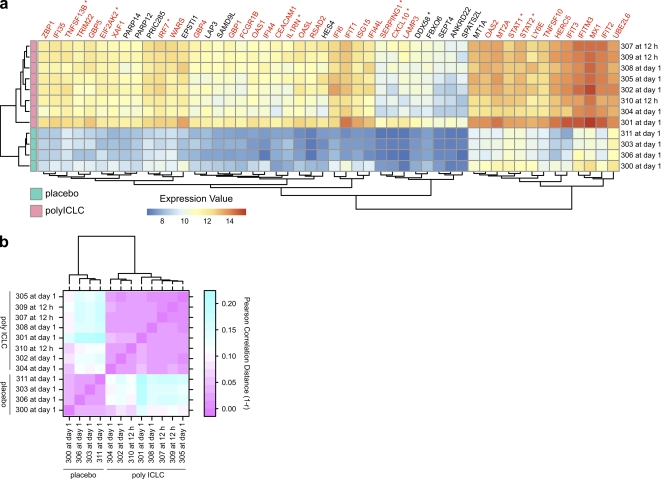
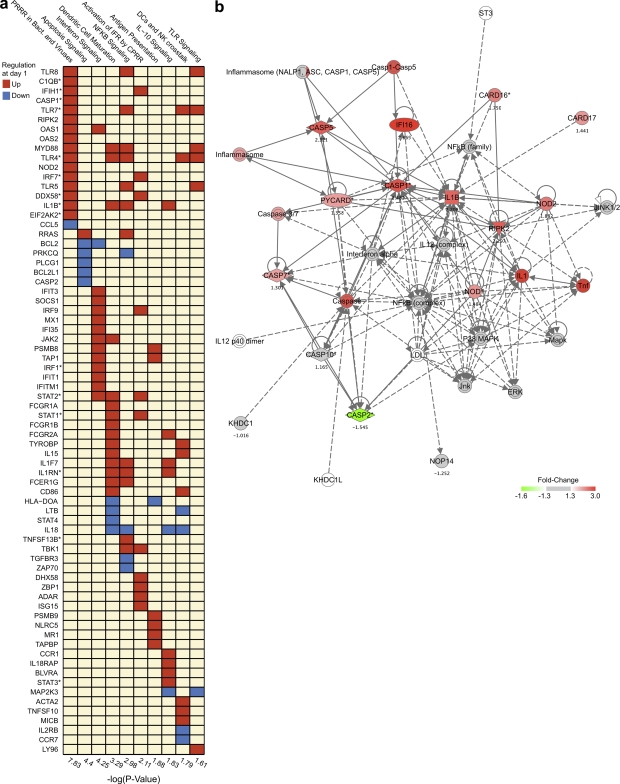
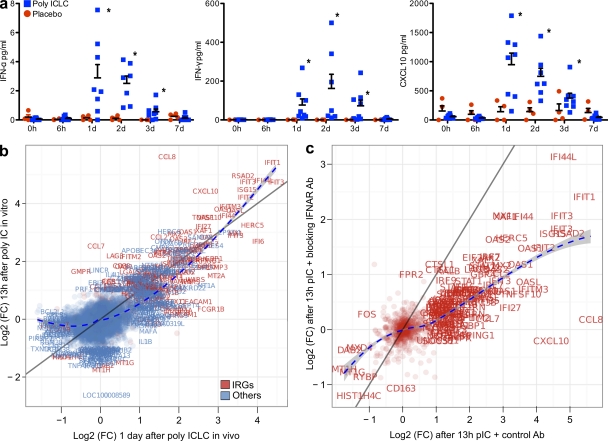
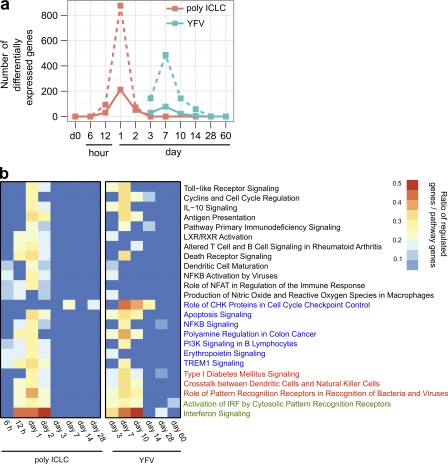
Adjuvants are critical for the success of vaccines. Agonists of microbial pattern recognition receptors (PRRs) are promising new adjuvant candidates. A mechanism through which adjuvants enhance immune responses is to stimulate innate immunity. We studied the innate immune response in humans to synthetic double-stranded RNA (polyinosinic:polycytidylic acid [poly IC] stabilized with poly-L-lysine [poly ICLC]), an agonist for toll-like receptor (TLR) 3, and the cytosolic RNA helicase MDA-5. Transcriptional analysis of blood samples from eight volunteers, after subcutaneous administration of poly ICLC, showed up-regulation of genes involved in multiple innate immune pathways in all subjects, including interferon (IFN) and inflammasome signaling. Blocking type I IFN receptor ex vivo significantly dampened the response to poly IC. Comparative transcriptional analysis showed that several innate immune pathways were similarly induced in volunteers immunized with the highly efficacious yellow fever vaccine. Therefore, a chemically defined PRR agonist like poly ICLC can be a reliable and authentic microbial mimic for inducing innate immune responses in humans.


Figures

Figure 1.
Figure 1.
s.c. poly ICLC induces transient local and systemic reactogenicity. (a) Typical local erythematosus skin reaction in the area of poly ICLC s.c. administration (representative subject). (b and c) Frequency of local (pain/tenderness at injection site, erythema, and induration; b) and systemic (fever, headache, myalgia, and malaise; c) adverse events in the first week after poly ICLC (n = 8) or placebo administration (n = 4).
Figure 2.
Figure 2.
Poly ICLC reliably induces IFN signaling in healthy volunteers. (a) Heat map representation of the normalized expression values. Genes shown are the top 50 differentially expressed at day 1 (FC > 2 at 5% FDR), the group-level peak time point (poly ICLC n = 8 or placebo n = 4). Each volunteer who received poly ICLC (horizontal rows) is represented at the volunteer-specific peak time (right labels), as in Fig. S2. IRGs are highlighted in red. *, genes discussed in the text. (b) Heat map representation of the between-subject correlation of the expression values for IRGs at subject-specific peak times after poly ICLC administration. The color gradient extends from pink, representing perfect correlation (or a correlation distance r of 0, i.e., 1 − r = 0), to cyan for low correlation.
Figure 3.
Figure 3.
Poly ICLC induces multiple genes of innate immunity including inflammasome components. (a) Each column is an up-regulated canonical pathway for innate immunity (Ingenuity software); each row represents an up-regulated (red) or down-regulated (blue) gene included in one or more regulated pathways. The over-representation test was performed using Fisher’s Exact Test, and the significance, displayed on the right, is achieved for P < 0.05 (−log(p) > 1.3). *, genes discussed in the text. CPRR, cytosolic PRR; PRRR, PRR recognition. (b) Network analysis of inflammasome gene signature induced 1 d after poly ICLC, generated with the Ingenuity software.
Figure 4.
Figure 4.
Validation of the transcriptional profiling on PBMCs. (a) Poly ICLC induced systemic secretion of IFNs. Plasma concentrations of IFN-γ, IFN-α, and CXCL10 at time points after poly ICLC (blue, n = 8) or placebo (red, n = 4) were analyzed by two-way ANOVA. Error bars represent the standard error of the mean concentrations. Poly ICLC effects were significant at days 1–3 (*, P < 0.001). (b and c) PBMCs from four donors were stimulated with 50 µg/ml poly IC for 13 h plus 10 µg/ml IFNAR antibody or isotype control antibody. RNA was extracted for transcriptional analysis. (b) Differential gene expression in blood 1 d after in vivo poly ICLC (x axis, n = 8) was compared with differential gene expression in PBMCs after 13 h of poly IC stimulation in vitro (y axis, n = 4). Genes falling on the identity line (dark gray) are equally regulated in both systems. A loss curve (dashed blue) is used to infer the local trend between the two systems. IRGs are in red. Text labels are added to points for genes with FC > 2 at 5% FDR in at least one comparison. (c) Log2(FC) of IRGs after in vitro poly IC with blocking anti-IFNAR mAb (y axis) and after in vitro poly IC with control antibody (x axis).
Figure 5.
Figure 5.
Poly ICLC activated similar innate immune pathways as YF17D. (a) Differentially expressed genes (DEGs) after poly ICLC (n = 8, versus placebos; n = 4, at same time points) or YF17D (versus day 0, n = 15; Gaucher et al., 2008) at several time points after administration. The threshold of differential expression is set at FDR 5%, with either FC > 2 (solid line) or FC > 1.3 (dashed line). Peak transcriptional changes are shown after poly ICLC (212 DEGs, day 1) and YF17D (78 DEGs, day 7). (b) Heat map showing statistically significant canonical pathways (Ingenuity Pathway Analysis Software) commonly regulated by poly ICLC and YF17D at least at four different time points. Columns represent time points after either poly ICLC or YF17D. Rows represent significantly regulated canonical pathways. Heat map colors represent the ratio of regulated genes/pathway genes after poly ICLC or YF17D (pathways not overrepresented are dark blue). Maximum pathway modulation similarity was obtained between poly ICLC at day 1 and YF17D at day 7. Pathways were significantly regulated at 7 of 14 different time points analyzed (green) and at 6, 5, and 4 time points in red, blue, and black, respectively. The overrepresentation test was performed using Fisher’s Exact Test. Statistical significance was achieved at P < 0.05.

Comment in

References

    1. Alexopoulou L., Holt A.C., Medzhitov R., Flavell R.A. 2001. Recognition of double-stranded RNA and activation of NF-kappaB by Toll-like receptor 3. Nature. 413:732–738 10.1038/35099560 - DOI - PubMed
    1. Amit I., Garber M., Chevrier N., Leite A.P., Donner Y., Eisenhaure T., Guttman M., Grenier J.K., Li W., Zuk O., et al. 2009. Unbiased reconstruction of a mammalian transcriptional network mediating pathogen responses. Science. 326:257–263 10.1126/science.1179050 - DOI - PMC - PubMed
    1. Benjamini Y., Hochberg Y. 1995. Controlling the false discovery rate: a practical and powerful approach to multiple testing. J. R. Stat. Soc. Series B Stat. Methodol. 57:289–300
    1. Beutler B. 2004. Inferences, questions and possibilities in Toll-like receptor signalling. Nature. 430:257–263 10.1038/nature02761 - DOI - PubMed
    1. Coffman R.L., Sher A., Seder R.A. 2010. Vaccine adjuvants: putting innate immunity to work. Immunity. 33:492–503 10.1016/j.immuni.2010.10.002 - DOI - PMC - PubMed

Publication types

MeSH terms

Associated data