. 2011 Nov 22;108(47):19090-5.
doi: 10.1073/pnas.1116998108. Epub 2011 Nov 7.

Metabolic cycling without cell division cycling in respiring yeast

Affiliations

Metabolic cycling without cell division cycling in respiring yeast

Nikolai Slavov et al. Proc Natl Acad Sci U S A. .

Abstract

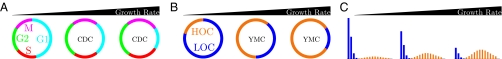
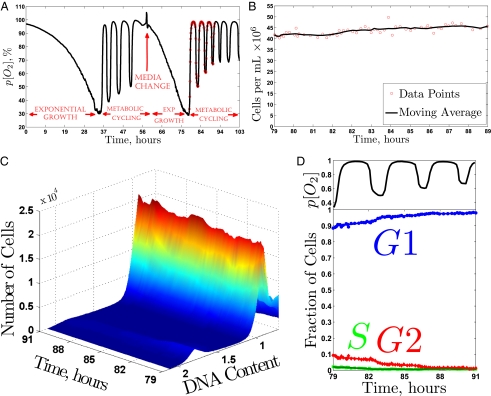
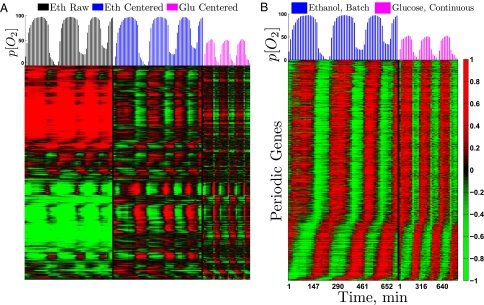
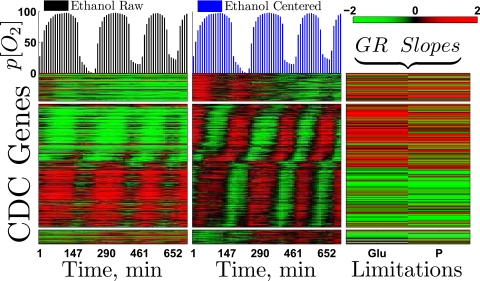
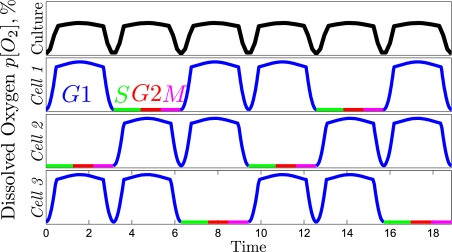
Despite rapid progress in characterizing the yeast metabolic cycle, its connection to the cell division cycle (CDC) has remained unclear. We discovered that a prototrophic batch culture of budding yeast, growing in a phosphate-limited ethanol medium, synchronizes spontaneously and goes through multiple metabolic cycles, whereas the fraction of cells in the G1/G0 phase of the CDC increases monotonically from 90 to 99%. This demonstrates that metabolic cycling does not require cell division cycling and that metabolic synchrony does not require carbon-source limitation. More than 3,000 genes, including most genes annotated to the CDC, were expressed periodically in our batch culture, albeit a mere 10% of the cells divided asynchronously; only a smaller subset of CDC genes correlated with cell division. These results suggest that the yeast metabolic cycle reflects a growth cycle during G1/G0 and explains our previous puzzling observation that genes annotated to the CDC increase in expression at slow growth.


Conflict of interest statement

The authors declare no conflict of interest.

Figures

Fig. 1.
Fig. 1.
Growth-rate (GR) changes in the yeast metabolic cycle and the cell division cycle. Changes in the relative duration of the phases of (A) the CDC and (B) the YMC (3). (C) Distributions of the number of mRNAs per cell of a ribosomal gene in an asynchronous culture growing at three growth rates.
Fig. 2.
Fig. 2.
Oxygen, biomass, and DNA content data in a metabolically cycling nondividing culture. (A) Dissolved oxygen in the medium reflecting the oxygen consumption. The culture was sampled at the positions indicated by red circles. (B) Cell density at each of the sampled points. (C) Distribution of DNA content obtained by FACS counting 150,000 cells labeled with SYTOX Green. (D) Fraction of cells in the CDC phases as inferred from the DNA content.
Fig. 3.
Fig. 3.
Global pattern of periodic gene expression in metabolically cycling cultures. (A) Hierarchically clustered, log2-transformed, gene-expression data from YMC cultures. (Left) The black bars at the top display dissolved oxygen and correspond to the expression levels in our batch culture (Fig. 2) relative to a glucose-limited culture, μ = 0.25 h−1. (Center) The blue bars correspond to the same data but centered to a zero mean for each gene. (Right) The magenta bars correspond to mean centered data from a continuous glucose-limited culture (10). The clustering is based on noncentered Pearson correlation computed from all data shown in the panel. The dissolved oxygen in the media of the two cultures is indicated by bars at the top (SI Appendix). (B) The expression levels of about 90% of the periodic genes (more than 3,000) have the same phase in the batch culture (Fig. 2) and in the continuous culture (10). These genes are ordered by phase of peak expression (Materials and Methods and SI Appendix).
Fig. 4.
Fig. 4.
Genes annotated to the CDC are periodically expressed in a nondividing culture in correlation with the metabolic cycle. (Left) Expression levels relative to the reference (glucose limitation at μ = 0.25 h−1). (Center) The same data centered to mean zero. (Right) The growth-rate (GR) slopes of the corresponding genes in asynchronous cultures (2). We previously computed GR slopes by regressing transcript levels of asynchronous cultures against the growth rate (2, 3); positive GR slopes indicate increasing expression with growth rate, and negative GR slopes indicate decreasing expression.
Fig. 5.
Fig. 5.
Composition of a continuous metabolically synchronized culture. A model for the composition of a metabolically synchronized culture consisting of three synchronized subpopulations depicted by a representative cell. Note that we do not have direct data for the oxygen consumption during the S/G2/M phases and that not all cells need to have the same number of metabolic cycles before entering S phase.

References

    1. Hartwell LH, Unger MW. Unequal division in Saccharomyces cerevisiae and its implications for the control of cell division. J Cell Biol. 1977;75:422–435. - PMC - PubMed
    1. Brauer MJ, et al. Coordination of growth rate, cell cycle, stress response, and metabolic activity in yeast. Mol Biol Cell. 2008;19:352–367. - PMC - PubMed
    1. Slavov N, Botstein D. Coupling among growth rate response, metabolic cycle, and cell division cycle in yeast. Mol Biol Cell. 2011;22:1997–2009. - PMC - PubMed
    1. Küenzi MT, Fiechter A. Changes in carbohydrate composition and trehalase-activity during the budding cycle of Saccharomyces cerevisiae. Arch Mikrobiol. 1969;64:396–407. - PubMed
    1. Silverman SJ, et al. Metabolic cycling in single yeast cells from unsynchronized steady-state populations limited on glucose or phosphate. Proc Natl Acad Sci USA. 2010;107:6946–6951. - PMC - PubMed

Publication types

MeSH terms

LinkOut - more resources