. 2011 Nov 22;108(47):E1195-203.
doi: 10.1073/pnas.1108942108. Epub 2011 Nov 7.

Nanostructure of cellulose microfibrils in spruce wood

Affiliations

Nanostructure of cellulose microfibrils in spruce wood

Anwesha N Fernandes et al. Proc Natl Acad Sci U S A. .

Abstract

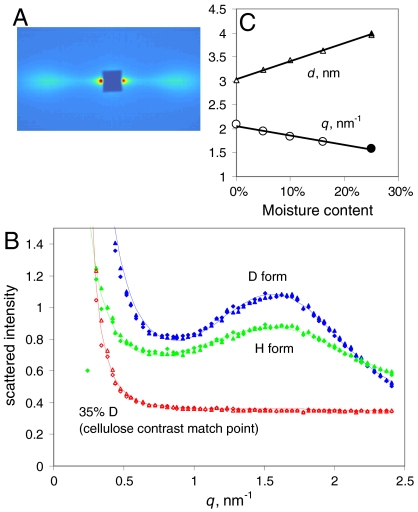
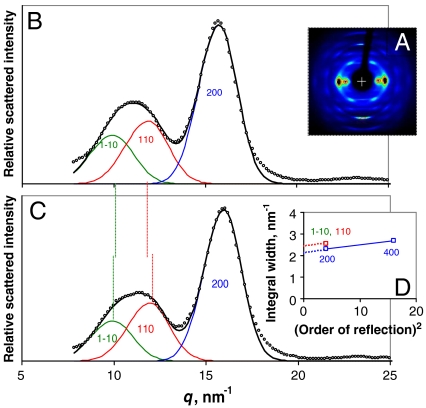
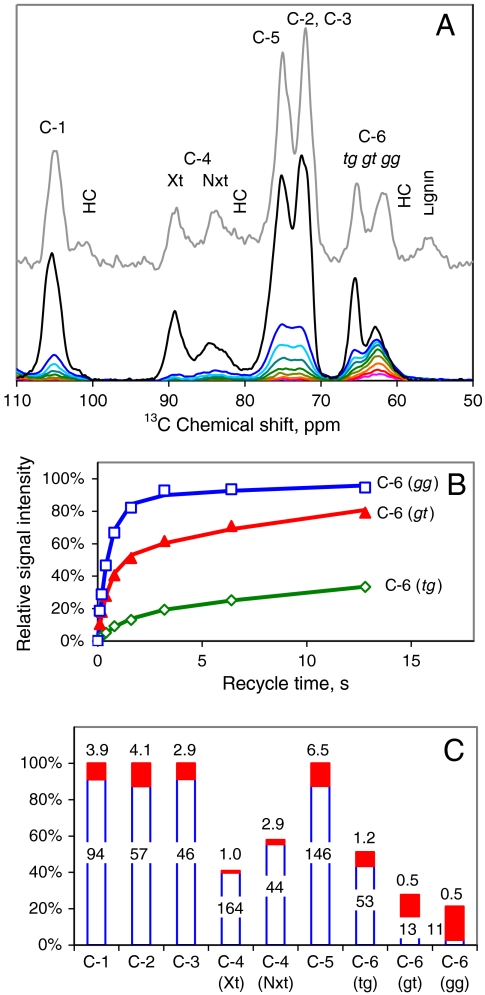
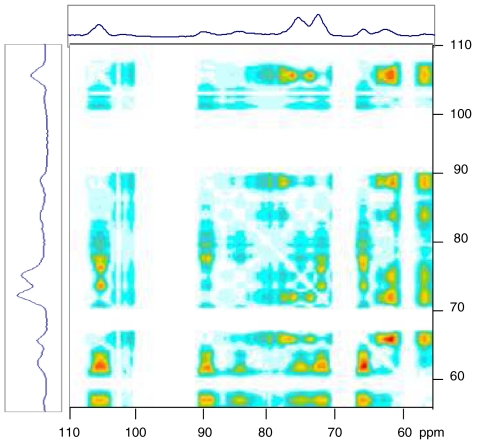
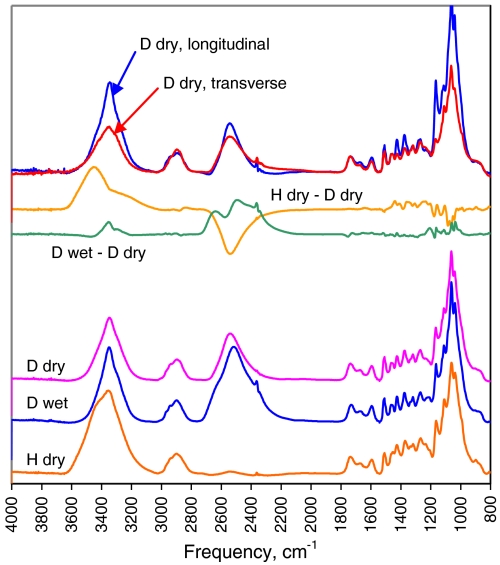
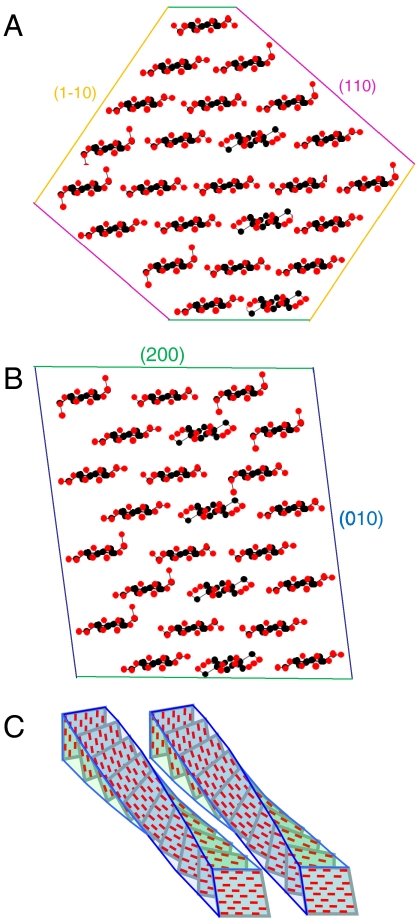
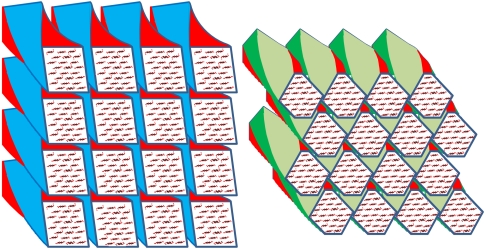
The structure of cellulose microfibrils in wood is not known in detail, despite the abundance of cellulose in woody biomass and its importance for biology, energy, and engineering. The structure of the microfibrils of spruce wood cellulose was investigated using a range of spectroscopic methods coupled to small-angle neutron and wide-angle X-ray scattering. The scattering data were consistent with 24-chain microfibrils and favored a "rectangular" model with both hydrophobic and hydrophilic surfaces exposed. Disorder in chain packing and hydrogen bonding was shown to increase outwards from the microfibril center. The extent of disorder blurred the distinction between the I alpha and I beta allomorphs. Chains at the surface were distinct in conformation, with high levels of conformational disorder at C-6, less intramolecular hydrogen bonding and more outward-directed hydrogen bonding. Axial disorder could be explained in terms of twisting of the microfibrils, with implications for their biosynthesis.


Conflict of interest statement

The authors declare no conflict of interest.

Figures

Fig. 1.
Fig. 1.
SANS from spruce wood. (A). SANS pattern at 25% hydration with D2O, showing equatorial Bragg reflections at q = 1.6 nm-1. The fiber axis is vertical. (B). Radial profiles of SANS intensity at 25% hydration with D2O, H2O and a 35∶65 mixture of D2O with H2O, matching the scattering length density of cellulose based on its elemental composition. (C). Variation in position of the center of the fitted radial intensity peak with the level of hydration with D2O, and the corresponding d-spacings between microfibril centers.
Fig. 2.
Fig. 2.
Wide-angle X-ray scattering from spruce wood. (A). WAXS pattern from dry spruce wood. (B). Background-corrected equatorial WAXS profiles from dry spruce wood with the 1–10, 110, and 200 reflections fitted by asymmetric functions, using the approximation that the widths of the overlapping 1–10 and 110 reflections were equal. (C). Background-corrected equatorial WAXS profiles from hydrated spruce wood, processed as (B). (D). Variation of the widths of the equatorial reflections with the square of the reflection order. The slope of the line connecting the widths of the 200 and 400 reflections depends on the mean value of the disorder factor and its intercept approximates to the disorder-corrected width. In the absence of measurable higher-order reflections the intercept was estimated for the 1–10 and 110 reflections using the same slope.
Fig. 3.
Fig. 3.
13C spin-lattice NMR relaxation experiments on spruce cellulose. (A). All cellulose chains are represented in the CP-MAS spectra of spruce wood (top spectrum) and cellulose isolated from it (second top). Shortening the recycle times in the MOST experiment restricted the spectral contribution progressively to the most mobile carbon atoms, particularly C-6. The MOST recycle times were (third to bottom) 12.8, 6.4, 3.2, 1.6, 0.8, 0.4, 0.2, and 0.1 s. The scaling of the CP-MAS spectra relative to the MOST spectra is arbitrary. (B). Relative intensity of the deconvoluted tg, gt, and gg components of the C-6 signal from isolated spruce cellulose as a function of recycle time in the MOST experiment, with dual-exponential fitted curves. (C). Dual-exponential fitted parameters. The histogram shows the proportions of the long-T1 and short-T1 components of each signal and the figures are the corresponding T1 values in s.
Fig. 4.
Fig. 4.
2D representation of spectral data from a proton spin-diffusion experiment on hydrated spruce wood. The 13C spectra are shown at top and side. Cross peaks correspond to the relative area enclosed between the T1-corrected spin equilibration curves for the signals at the two chemical shifts concerned. For a cross peak to be generated between two 13C signals the initial levels of proton magnetization around the two 13C nuclei must differ and significant time must elapse before they equilibrate by proton spin diffusion. That is, the two 13C nuclei must be spatially separated.
Fig. 5.
Fig. 5.
Baseline-corrected transmission FTIR spectra of spruce wood. From bottom; in the dry state (H dry), then equilibrated with D2O (D wet) and then dried without access to H2O (D dry). Deuteration moved the O-H stretching bands from accessible hydroxyl groups (3,200–3,500 cm-1) to the O-D stretching region (2,300–2,600 cm-1). Difference spectra show effects of deuteration (H dry—D dry) and of drying in the deuterated state (D wet—D dry). Top: polarized spectra after deuteration and drying.
Fig. 6.
Fig. 6.
Chain packing arrangements for alternative shapes of spruce cellulose microfibrils. (A). Diamond shape. 24 chains, overall dimensions 3.2 × 3.9 nm. Weighted-mean column lengths normal to lattice planes (002), 2.7 nm; (1–10), 3.2 nm, (110), 2.6 nm. (B). Rectangular shape. 24 chains, overall dimensions 3.2 × 3.1 nm. Weighted-mean column lengths normal to lattice planes (002), 3.2 nm; (1–10), 2.8 nm, (110), 2.5 nm. Shape (B) is in closer accord with the observed Scherrer dimensions corrected for disorder. (C) Schematic diagram of two adjacent twisted microfibrils. Even if they have the same helical pitch, the ability of any crystal face to bind against the corresponding crystal face in the next microfibril is progressively lost with distance along the microfibril axis.
Fig. P1.
Fig. P1.
Schematic of chain and microfibril packing arrangements for a 4 × 4 aggregate of 24-chain spruce cellulose microfibrils with alternative shapes. Left: rectangular shape. Right: diamond shape. The rectangular shape is in closer accord with the dimensions observed by X-ray scattering using the Scherrer equation corrected for disorder. Twisting of the microfibrils prevents their coalescence by ensuring that even if, hypothetically, their crystal planes are aligned as in the transverse section shown, this alignment is quickly lost further along the microfibril aggregate.

References

    1. Dixon RK, et al. Carbon pools and flux of global forest ecosystems. Science. 1994;263:185–190. - PubMed
    1. Carroll A, Somerville C. Cellulosic biofuels. Annu Rev Plant Biol. 2009;60:165–182. - PubMed
    1. Xu P, Donaldson LA, Gergely ZR, Staehelin LA. Dual-axis electron tomography: a new approach for investigating the spatial organization of wood cellulose microfibrils. Wood Sci Technol. 2007;41:101–116.
    1. Atalla RH, Vander Hart DL. The role of solid state C-13 NMR spectroscopy in studies of the nature of native celluloses. Solid State Nucl Mag. 1999;15:1–19. - PubMed
    1. Vietor RJ, Newman RH, Ha MA, Apperley DC, Jarvis MC. Conformational features of crystal-surface cellulose from higher plants. Plant J. 2002;30:721–731. - PubMed

Publication types

LinkOut - more resources