. 2011 Dec 5;8(6):2039-49.
doi: 10.1021/mp200421k. Epub 2011 Nov 8.

Fibroblasts contribute to melanoma tumor growth and drug resistance

Affiliations

Fibroblasts contribute to melanoma tumor growth and drug resistance

Edward H Flach et al. Mol Pharm. .

Abstract

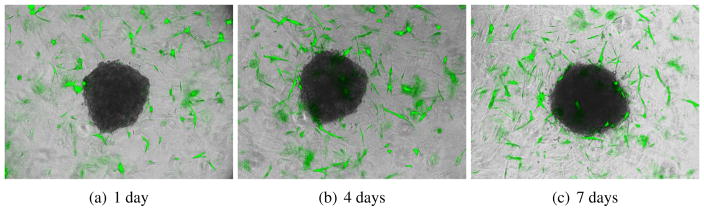
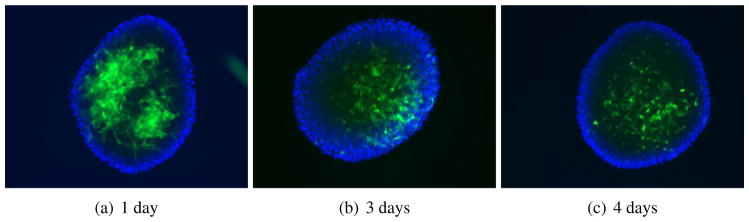
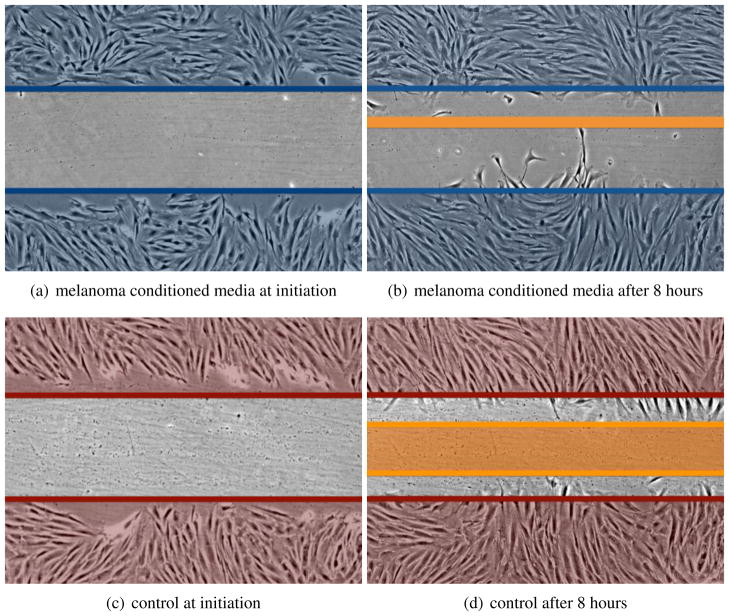
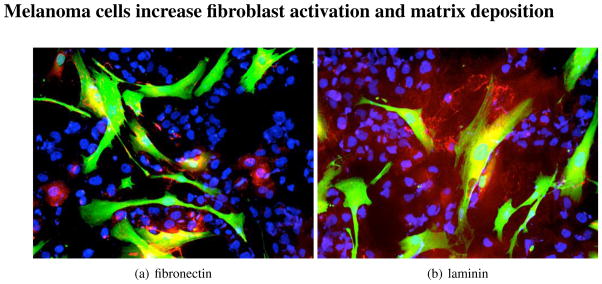
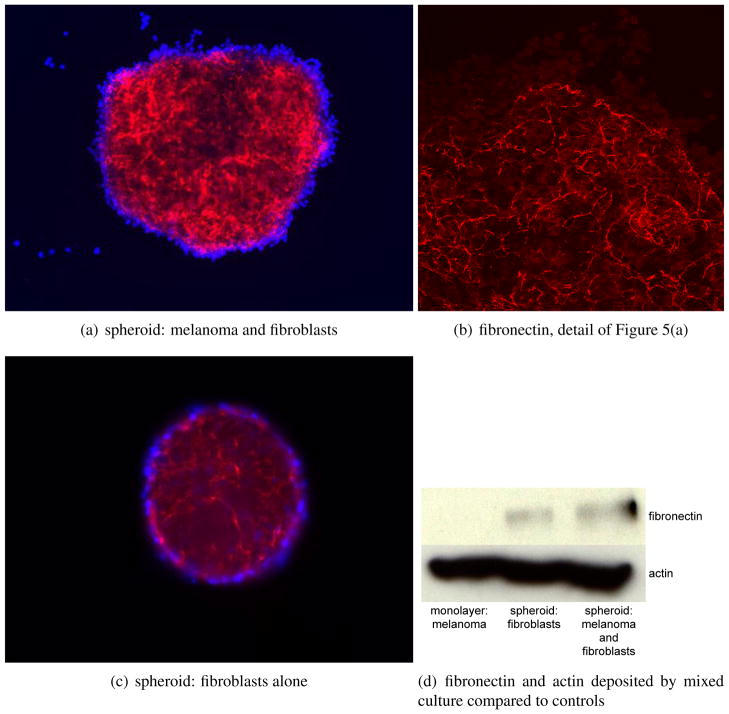
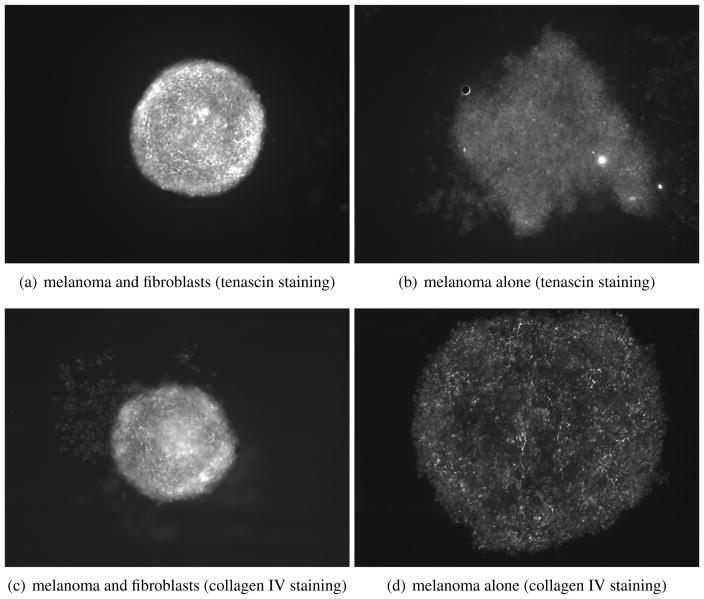
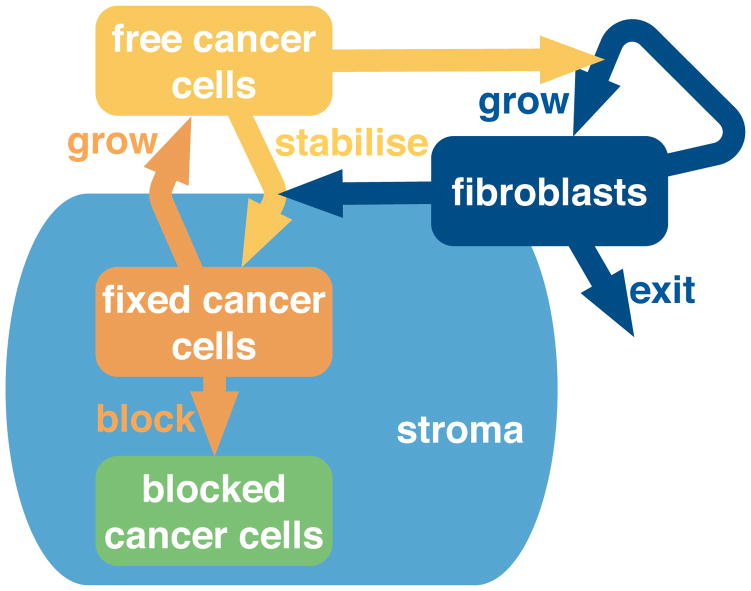
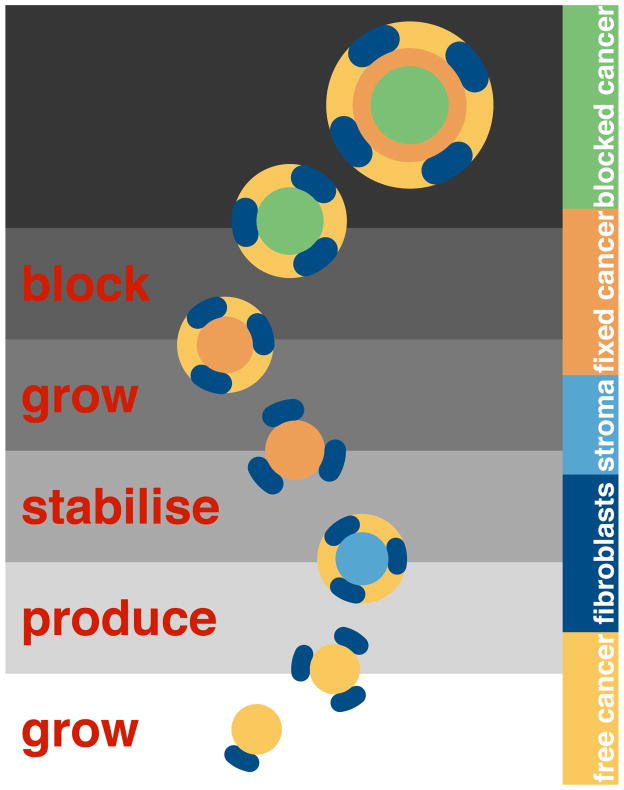
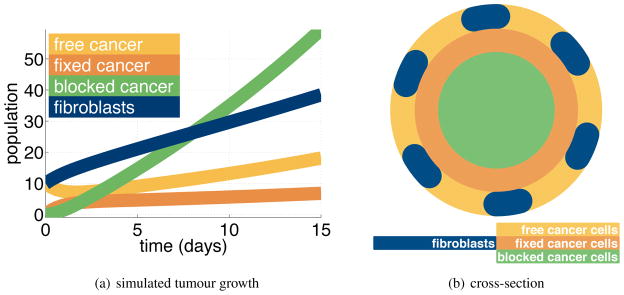
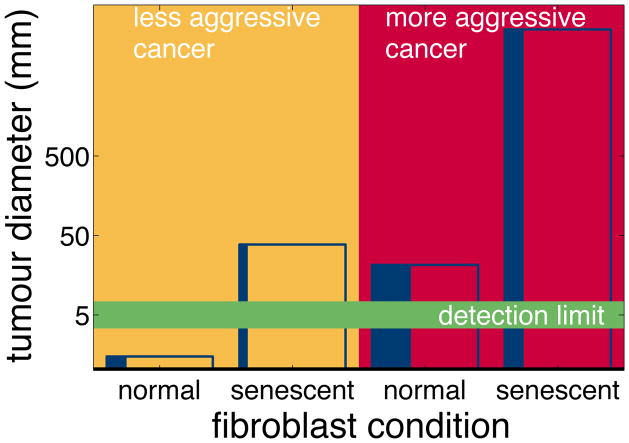
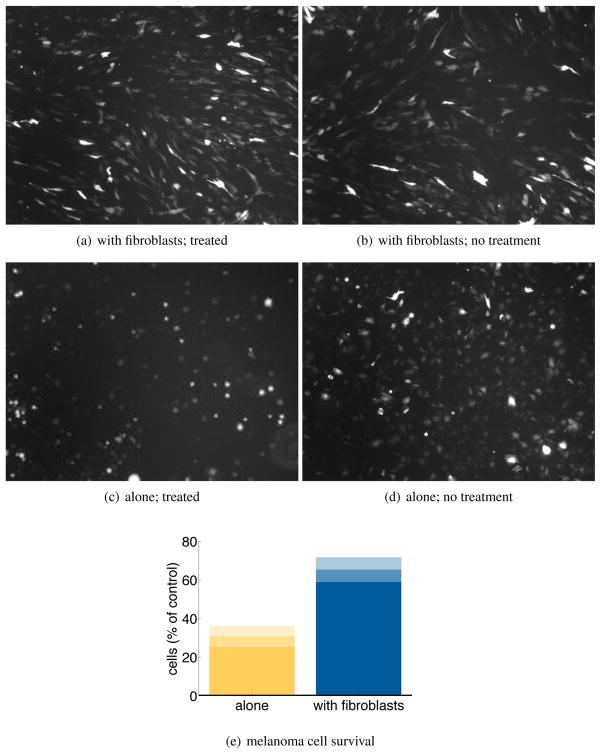
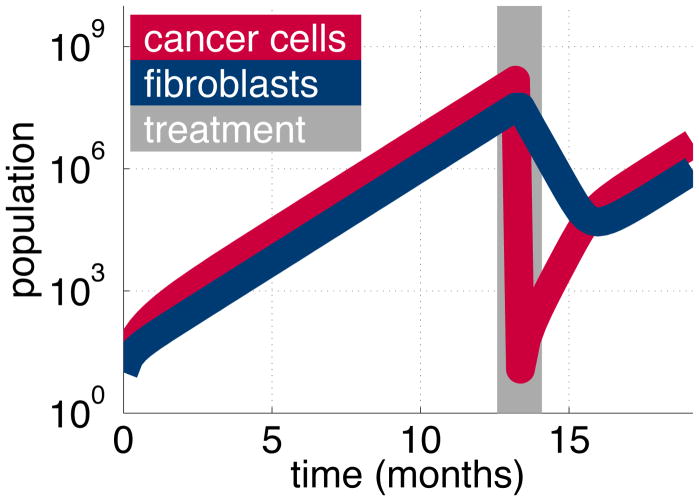
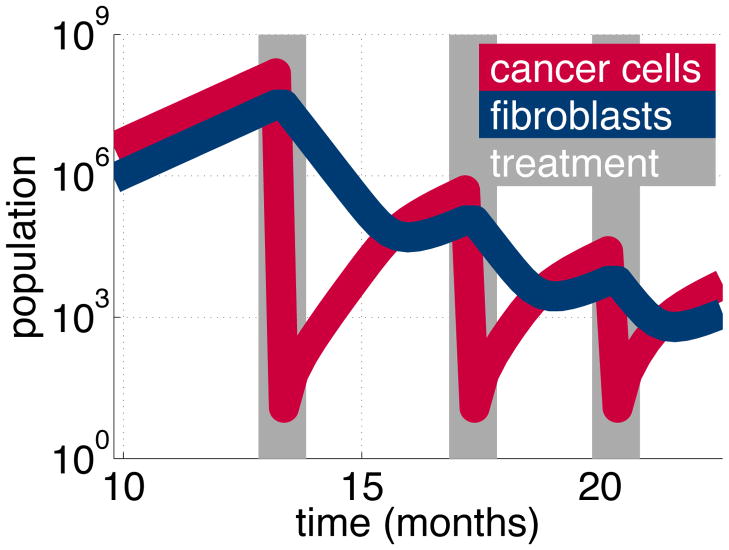
The role of tumor-stromal interactions in progression is generally well accepted, but their role in initiation or treatment is less well understood. It is now generally agreed that, rather than consisting solely of malignant cells, tumors consist of a complex dynamic mixture of cancer cells, host fibroblasts, endothelial cells and immune cells that interact with each other and microenvironmental factors to drive tumor progression. We are particularly interested in stromal cells (for example fibroblasts) and stromal factors (for example fibronectin) as important players in tumor progression since they have also been implicated in drug resistance. Here we develop an integrated approach to understand the role of such stromal cells and factors in the growth and maintenance of tumors as well as their potential impact on treatment resistance, specifically in application to melanoma. Using a suite of experimental assays we show that melanoma cells can stimulate the recruitment of fibroblasts and activate them, resulting in melanoma cell growth by providing both structural (extracellular matrix proteins) and chemical support (growth factors). Motivated by these experimental results we construct a compartment model and use it to investigate the roles of both stromal activation and tumor aggressiveness in melanoma growth and progression. We utilize this model to investigate the role fibroblasts might play in melanoma treatment resistance and the clinically observed flare phenomenon that is seen when a patient, who appears resistant to a targeted drug, is removed from that treatment. Our model makes the unexpected prediction that targeted therapies may actually hasten tumor progression once resistance has occurred. If confirmed experimentally, this provocative prediction may bring important new insights into how drug resistance could be managed clinically.


Figures

Figure 1
Figure 1
Melanoma cells recruit fibroblasts that then infiltrate the tumour. We implanted melanoma spheroids into a 3D collagen gel containing fibroblasts tagged with green fluorescent protein (green). After 4 days of culture, the fibroblasts are migrating towards the melanoma spheroid; by 7 days some fibroblasts start to infiltrate and grow into the spheroid.
Figure 2
Figure 2
GFP-tagged fibroblasts adhere to and infiltrate melanoma spheroids. 5000 fibroblasts were carefully pipetted on top of preformed melanoma spheroids on top of agar. Images show immunofluorescence microscopy of whole spheroids showing the infiltration of the fibroblasts (green).
Figure 3
Figure 3
Conditioned media from melanoma cells increases the motility of fibroblasts. Human skin fibroblasts (FF2441) were grown to confluence before being subjected to a scratch wound in the presence of either serum free media, or serum free media conditioned for 48 hrs by 1205Lu melanoma cells. Representative images show the extent of wound closure at 8 hrs.
Figure 4
Figure 4
Melanoma cells (blue) activate fibroblasts (green), leading to increased ECM deposition (red). 2D monolayer cultures of WM793 melanoma cells (shown by blue 4′,6-diamidino-2-phenylindole (DAPI) staining) and GFP-tagged fibroblasts (green) after 48 hrs of co-culture. Slides are stained red for Figure 4(a) fibronectin or Figure 4(b) laminin.
Figure 5
Figure 5
Melanoma cells can induce matrix production in fibroblasts. Mixing melanoma cells with fibroblasts increases the deposition and organisation of fibronectin when compared to growing fibroblasts on their own. Melanoma line is WM1366, fibroblasts are FF2441. Red staining is fibronectin, blue is DAPI. Figure 5(a) fibronectin produced by a fibroblast and melanoma cell spheroid. Figure 5(b) detail of fibronectin in the mixed spheroid (confocal). Figure 5(c) fibronectin produced by a fibroblast spheroid. Figure 5(d) levels of fibronectin and actin in 2D adherent cultures of melanoma cells alone, 3D cultures of melanoma alone and melanoma and fibroblast co-cultures. Melanoma cells alone produce no fibronectin.
Figure 6
Figure 6
Fibroblasts organise and give structure to tumours. The presence of fibroblasts increases the organisation and ECM deposition of sphere cultures compared to melanoma cell monoculture spheroids. Spheres were allowed to grow for 72 hrs before being fixed and stained for tenascin and collagen IV (also laminin, not shown).
Figure 7
Figure 7
Cancer cells and fibroblasts stimulate each other; the tumour progresses and grows. A compartment model describes the cell states and the interactions between them. Free cancer cells are new and unsupported by matrix. To obtain matrix, they attract fibroblasts, or stimulate them to divide. The fibroblasts produce matrix, which stabilises the free cancers cells: they become fixed. Fixed cancer cells can divide, but by doing so block themselves in physically – becoming blocked cancer cells. Stroma is implicit in the model; we show in the diagram that it is associated with the fixed and blocked cancer cells – but not with the free cancer cells. We allow fibroblasts to exit, which means they become inactive, or leave the tumour.
Figure 8
Figure 8
Each interaction is a step in tumour growth. Here we show the first few steps of the dynamic model. This discrete breakdown is artificial, but demonstrates the assumptions at work. The population of each compartment grows. The initial conditions are simple: a pool of inactive fibroblasts, and a few free cancer cells. Time progresses vertically with the initial state of the system at the bottom of the figure. At the start, there are only free cancer cells (yellow) and a few fibroblasts (dark blue). The cancer cells stimulate the fibroblasts to increase in number. Then the fibroblasts produce stroma (light blue). In the fourth step, the free cancer cells migrate onto the stroma and stabilise (orange). These fixed cancer cells divide and produce new free cancer cells. In the process of division, the fixed cells block themselves in, and so become blocked (green).
Figure 9
Figure 9
Figure 9(a)The simulation yields tumour growth. Most of the population is blocked cancer cells. We see a smaller number of the other populations: fibroblasts, free cancer cells, fixed cancer cells. In the long term, all the populations increase exponentially at the same rate. Figure 9(b)The simulation represents a layered tumour with a quiescent core. Here we show a cross section.
Figure 10
Figure 10
Fibroblast condition is as important as cancer type. In each column we show the results of a single simulation of two years of tumour growth. The height of each column shows the total tumour diameter. The width of the vertical blue band shows the proportion of fibroblasts within each tumour. We vary the aggressiveness of the cancer cells, and the condition of the fibroblasts. In the first column, less aggressive cancer cells together with normal fibroblasts grow very slowly. The tumour is so small, even after two years, that it is too small to be detected by a clinician. In the second column, less aggressive cancer cells do not stimulate fibroblast division so there are relatively few fibroblasts present. However, these fibroblasts are activated and so produce stroma rapidly. A substantial tumour grows, in comparison to the first scenario. In the third column, aggressive cancer cells stimulate fibroblast production, so the tumour has a high proportion of fibroblasts. However, these normal fibroblasts produce less stroma; cancer cells stabilise slowly, so the tumour grows fairly slowly too. In this case, the aggressive cancer has produced a smaller tumour than the previous scenario of a less aggressive cancer paired with activated fibroblasts. The fourth column is aggressive cancers cells paired with activated fibroblasts: the tumour grows rapidly.
Figure 11
Figure 11
Activated fibroblasts increase the survival of melanoma cells under therapeutic drug treatment. Figure 11(a)-Figure 11(d) Representative microscope pictures showing GFP-tagged 1205Lu melanoma cells plated on either a fibroblast monolayer or normal tissue culture plastic and treated with either vehicle (0) or cisplatin (20 μM, 4 hours). Assessment is made 72 hours after the addition of cisplatin. Figure 11(e) Melanoma survival as a percentage of the vehicle treated control, with the mean bounded by standard deviation. Data is from 3 independent experiments.
Figure 12
Figure 12
After treatment (gray), the large fibroblast population (blue) causes the cancer cell population (red) to regrow rapidly. We simulate a mixed tumour of cancer cells and fibroblasts. Targeted therapy reduces the cancer cell population but not the fibroblasts. After treatment, the large pool of fibroblasts means that the cancer population regrows much more rapidly than before.
Figure 13
Figure 13
Repeating treatment (gray) controls the cancer population (red) while the fibroblast population (blue) gradually reduces. We simulate a mixed tumour of cancer cells and fibroblasts. Targeted therapy reduces the cancer cell population but not the fibroblasts. However, without stimulation, the fibroblast population declines naturally. Repeating treatment controls the cancer cell population, allowing the fibroblast population to revert to normal levels. After several treatments, the tumour regrows slowly, without flare.

References

    1. Smalley KSM, Lioni M, Herlyn M. Targeting the stromal fibroblasts: a novel approach to melanoma therapy. Expert Review of Anticancer Therapy. 2005;5:1069–1078. - PubMed
    1. Bissell M, Radisky D. Putting tumours in context. Nature Reviews Cancer. 2001;1:46–54. - PMC - PubMed
    1. Ruiter D, Bogenrieder T, Elder D, Herlyn M. Melanoma-stroma interactions: structural and functional aspects. The Lancet Oncology. 2002;3:35–43. - PubMed
    1. Cunha G, Hayward S, Wang Y, Ricke W. Role of the stromal microenvironment in carcinogenesis of the prostate. International Journal of Cancer. 2003;107:1–10. - PubMed
    1. Elenbaas B, Weinberg R. Heterotypic signaling between epithelial tumor cells and fibroblasts in carcinoma formation. Experimental Cell Research. 2001;264:169–184. - PubMed

Publication types

LinkOut - more resources