

Exploring the gonad transcriptome of two extreme male pigs with RNA-seq
- PMID: 22067327
- PMCID: PMC3221674
- DOI: 10.1186/1471-2164-12-552
Exploring the gonad transcriptome of two extreme male pigs with RNA-seq
Abstract
Background: Although RNA-seq greatly advances our understanding of complex transcriptome landscapes, such as those found in mammals, complete RNA-seq studies in livestock and in particular in the pig are still lacking. Here, we used high-throughput RNA sequencing to gain insight into the characterization of the poly-A RNA fraction expressed in pig male gonads. An expression analysis comparing different mapping approaches and detection of allele specific expression is also discussed in this study.
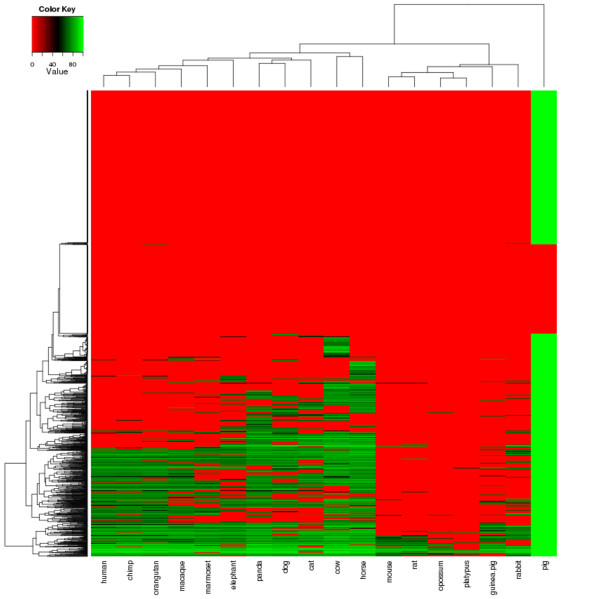
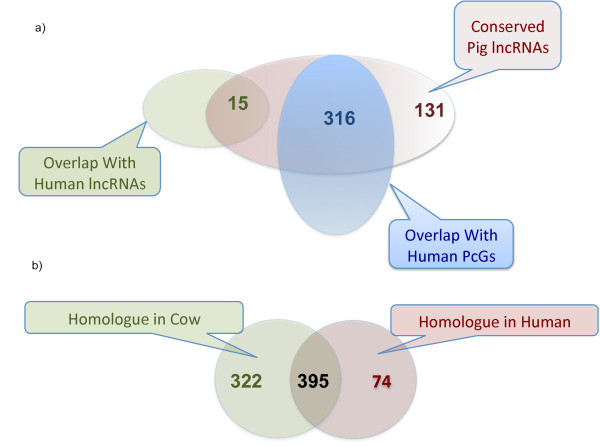
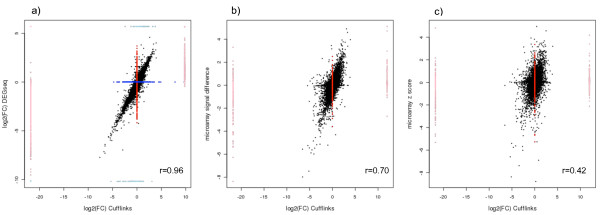
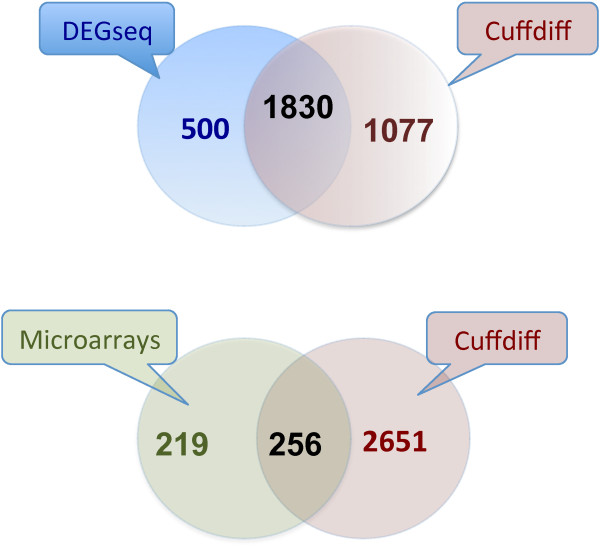
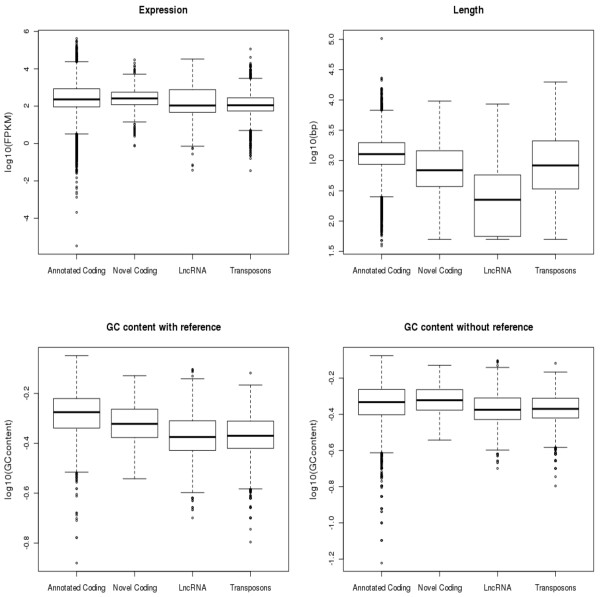
Results: By sequencing testicle mRNA of two phenotypically extreme pigs, one Iberian and one Large White, we identified hundreds of unannotated protein-coding genes (PcGs) in intergenic regions, some of them presenting orthology with closely related species. Interestingly, we also detected 2047 putative long non-coding RNA (lncRNA), including 469 with human homologues. Two methods, DEGseq and Cufflinks, were used for analyzing expression. DEGseq identified 15% less expressed genes than Cufflinks, because DEGseq utilizes only unambiguously mapped reads. Moreover, a large fraction of the transcriptome is made up of transposable elements (14500 elements encountered), as has been reported in previous studies. Gene expression results between microarray and RNA-seq technologies were relatively well correlated (r = 0.71 across individuals). Differentially expressed genes between Large White and Iberian showed a significant overrepresentation of gamete production and lipid metabolism gene ontology categories. Finally, allelic imbalance was detected in ~ 4% of heterozygous sites.
Conclusions: RNA-seq is a powerful tool to gain insight into complex transcriptomes. In addition to uncovering many unnanotated genes, our study allowed us to determine that a considerable fraction is made up of long non-coding transcripts and transposable elements. Their biological roles remain to be determined in future studies. In terms of differences in expression between Large White and Iberian pigs, these were largest for genes involved in spermatogenesis and lipid metabolism, which is consistent with phenotypic extreme differences in prolificacy and fat deposition between these two breeds.
Figures
Similar articles
-
Liver transcriptome profile in pigs with extreme phenotypes of intramuscular fatty acid composition.BMC Genomics. 2012 Oct 11;13:547. doi: 10.1186/1471-2164-13-547. BMC Genomics. 2012. PMID: 23051667 Free PMC article.
-
Comparative transcriptomic analysis to identify differentially expressed genes in fat tissue of adult Berkshire and Jeju Native Pig using RNA-seq.Mol Biol Rep. 2014 Sep;41(9):6305-15. doi: 10.1007/s11033-014-3513-y. Epub 2014 Jul 11. Mol Biol Rep. 2014. PMID: 25008993
-
Genome-Wide Analysis of mRNAs and lncRNAs of Intramuscular Fat Related to Lipid Metabolism in Two Pig Breeds.Cell Physiol Biochem. 2018;50(6):2406-2422. doi: 10.1159/000495101. Epub 2018 Nov 13. Cell Physiol Biochem. 2018. PMID: 30423578
-
Microarrays, deep sequencing and the true measure of the transcriptome.BMC Biol. 2011 May 31;9:34. doi: 10.1186/1741-7007-9-34. BMC Biol. 2011. PMID: 21627854 Free PMC article. Review.
-
RNA-Seq: a revolutionary tool for transcriptomics.Nat Rev Genet. 2009 Jan;10(1):57-63. doi: 10.1038/nrg2484. Nat Rev Genet. 2009. PMID: 19015660 Free PMC article. Review.
Cited by
-
Differences in muscle transcriptome among pigs phenotypically extreme for fatty acid composition.PLoS One. 2014 Jun 13;9(6):e99720. doi: 10.1371/journal.pone.0099720. eCollection 2014. PLoS One. 2014. PMID: 24926690 Free PMC article.
-
Comparative Analysis of Muscle Transcriptome between Pig Genotypes Identifies Genes and Regulatory Mechanisms Associated to Growth, Fatness and Metabolism.PLoS One. 2015 Dec 22;10(12):e0145162. doi: 10.1371/journal.pone.0145162. eCollection 2015. PLoS One. 2015. PMID: 26695515 Free PMC article.
-
Genome-wide transcriptome profiling uncovers differential miRNAs and lncRNAs in ovaries of Hu sheep at different developmental stages.Sci Rep. 2021 Mar 12;11(1):5865. doi: 10.1038/s41598-021-85245-y. Sci Rep. 2021. PMID: 33712687 Free PMC article.
-
Detecting and comparing non-coding RNAs in the high-throughput era.Int J Mol Sci. 2013 Jul 24;14(8):15423-58. doi: 10.3390/ijms140815423. Int J Mol Sci. 2013. PMID: 23887659 Free PMC article. Review.
-
Histological and transcriptome analyses of testes from Duroc and Meishan boars.Sci Rep. 2016 Feb 11;6:20758. doi: 10.1038/srep20758. Sci Rep. 2016. PMID: 26865000 Free PMC article.
