

LPS-induced murine systemic inflammation is driven by parenchymal cell activation and exclusively predicted by early MCP-1 plasma levels
- PMID: 22067909
- PMCID: PMC3338351
- DOI: 10.1016/j.ajpath.2011.10.001
LPS-induced murine systemic inflammation is driven by parenchymal cell activation and exclusively predicted by early MCP-1 plasma levels
Abstract
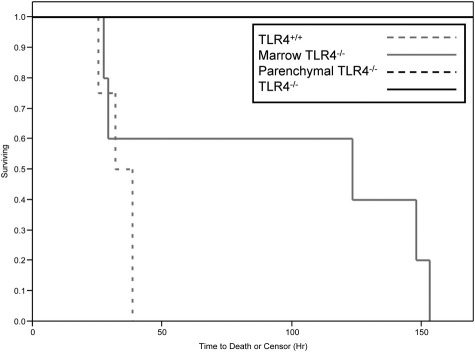
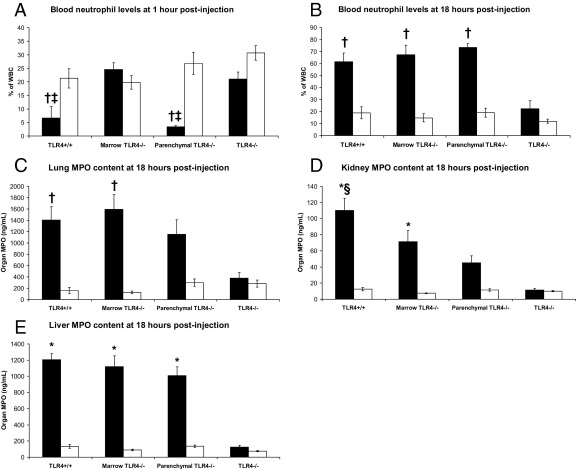
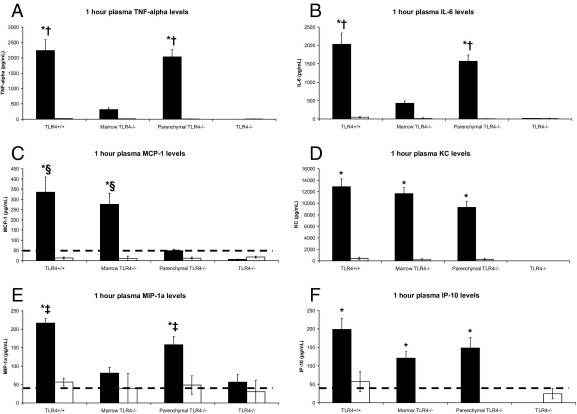
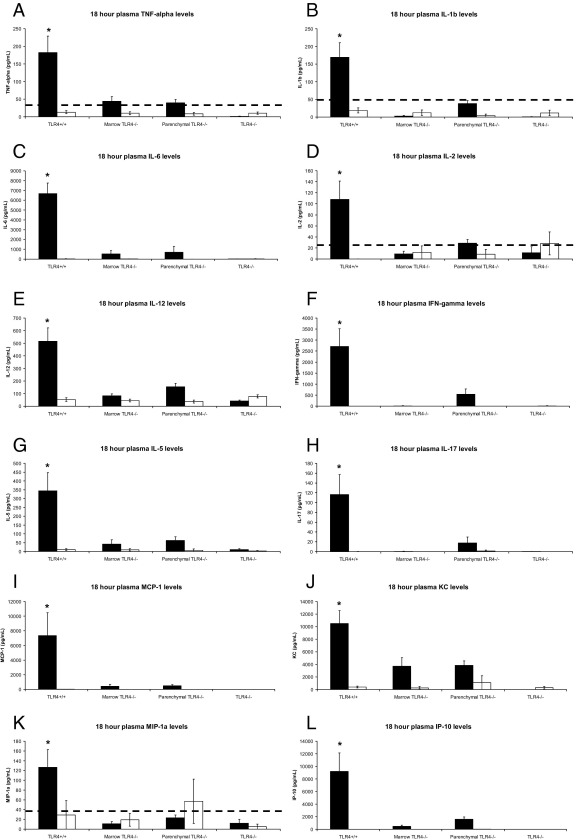
Systemic inflammation remains a major cause of morbidity and mortality in the United States, across many disease processes. One classic murine model to study this syndrome is lipopolysaccharide (LPS)-induced Toll-like receptor 4 (TLR4)-dependent systemic inflammation. Although most studies have focused on inflammatory cell TLR4 responses, parenchymal cells also express TLR4. Our objective was to define the in vivo role of parenchymal- versus marrow-derived cell activation via TLR4 during LPS-induced inflammation. Mice bearing TLR4 on parenchymal cells only, marrow-derived cells only, both, or neither were generated using bone marrow transplantation. Mortality occurred only in mice that had TLR4 expression on their parenchymal cells. Before onset, virtually all major plasma cytokines and blood neutrophil responses were related to marrow-derived cell activation via TLR4. The only cytokine predictive of oncoming systemic inflammation was the chemokine monocyte chemoattractant protein-1. Late blood neutrophil responses were related to the presence of TLR4 on either parenchymal or marrow cells, whereas plasma cytokine elevations late in LPS-induced systemic inflammation were dependent on mice having TLR4 in both cell compartments. Parenchymal cell activation via TLR4 is a key component of LPS-induced systemic inflammation and mortality, although most plasma cytokine levels and blood neutrophil responses were not key components. Given its unique role, future studies into monocyte chemoattractant protein-1's exact role during systemic inflammation are warranted.
Copyright © 2012 American Society for Investigative Pathology. Published by Elsevier Inc. All rights reserved.
Figures
Similar articles
-
Disparate roles of marrow- and parenchymal cell-derived TLR4 signaling in murine LPS-induced systemic inflammation.Sci Rep. 2012;2:918. doi: 10.1038/srep00918. Epub 2012 Dec 4. Sci Rep. 2012. PMID: 23213355 Free PMC article.
-
[Protection of huanglian jiedu decoction on systemic and vascular immune responses of high fat induced apoE(-/-) mice].Zhongguo Zhong Xi Yi Jie He Za Zhi. 2013 Nov;33(11):1520-5. Zhongguo Zhong Xi Yi Jie He Za Zhi. 2013. PMID: 24483114 Chinese.
-
Intracellular TLR4/MD-2 in macrophages senses Gram-negative bacteria and induces a unique set of LPS-dependent genes.Int Immunol. 2011 Aug;23(8):503-10. doi: 10.1093/intimm/dxr044. Epub 2011 Jun 28. Int Immunol. 2011. PMID: 21712422
-
Role of endothelial TLR4 for neutrophil recruitment into central nervous system microvessels in systemic inflammation.J Immunol. 2009 Oct 15;183(8):5244-50. doi: 10.4049/jimmunol.0901309. Epub 2009 Sep 28. J Immunol. 2009. PMID: 19786543
-
Toll-like receptor 4 on nonhematopoietic cells sustains CNS inflammation during endotoxemia, independent of systemic cytokines.J Neurosci. 2005 Feb 16;25(7):1788-96. doi: 10.1523/JNEUROSCI.4268-04.2005. J Neurosci. 2005. PMID: 15716415 Free PMC article.
Cited by
-
Water Extract of Chrysanthemum indicum L. Flower Inhibits Capsaicin-Induced Systemic Low-Grade Inflammation by Modulating Gut Microbiota and Short-Chain Fatty Acids.Nutrients. 2023 Feb 21;15(5):1069. doi: 10.3390/nu15051069. Nutrients. 2023. PMID: 36904069 Free PMC article.
-
The complex lipid, SPPCT-800, reduces lung damage, improves pulmonary function and decreases pro-inflammatory cytokines in the murine LPS-induced acute respiratory distress syndrome (ARDS) model.Pharm Biol. 2022 Dec;60(1):1255-1263. doi: 10.1080/13880209.2022.2087689. Pharm Biol. 2022. PMID: 35786152 Free PMC article.
-
Endotoxemia-mediated inflammation potentiates aminoglycoside-induced ototoxicity.Sci Transl Med. 2015 Jul 29;7(298):298ra118. doi: 10.1126/scitranslmed.aac5546. Sci Transl Med. 2015. PMID: 26223301 Free PMC article.
-
BET protein function is required for inflammation: Brd2 genetic disruption and BET inhibitor JQ1 impair mouse macrophage inflammatory responses.J Immunol. 2013 Apr 1;190(7):3670-8. doi: 10.4049/jimmunol.1202838. Epub 2013 Feb 18. J Immunol. 2013. PMID: 23420887 Free PMC article.
-
Abandon the mouse research ship? Not just yet!Shock. 2014 Jun;41(6):463-75. doi: 10.1097/SHK.0000000000000153. Shock. 2014. PMID: 24569509 Free PMC article.
References
-
- Bhatia M. Acute pancreatitis as a model of SIRS. Front Biosci. 2009;14:2042–2050. - PubMed
-
- Bhatia M., He M., Zhang H., Moochhala S. Sepsis as a model of SIRS. Front Biosci. 2009;14:4703–4711. - PubMed
-
- Dahiya P. Burns as a model of SIRS. Front Biosci. 2009;14:4962–4967. - PubMed
-
- Thomas L. The physiological disturbances produced by endotoxins. Annu Rev Physiol. 1954;16:467–490. - PubMed
-
- Poltorak A., He X., Smirnova I., Liu M.Y., Van Huffel C., Du X., Birdwell D., Alejos E., Silva M., Galanos C., Freudenberg M., Ricciardi-Castagnoli P., Layton B., Beutler B. Defective LPS signaling in C3H/HeJ and C57BL/10ScCr mice: mutations in Tlr4 gene. Science. 1998;282:2085–2088. - PubMed
Publication types
MeSH terms
Substances
Grants and funding
LinkOut - more resources
Full Text Sources
Other Literature Sources
Molecular Biology Databases
Research Materials
Miscellaneous
