. 2012 Jan 1;72(1):315-24.
doi: 10.1158/0008-5472.CAN-11-0961. Epub 2011 Nov 8.

EZH2 Mediates epigenetic silencing of neuroblastoma suppressor genes CASZ1, CLU, RUNX3, and NGFR

Affiliations

EZH2 Mediates epigenetic silencing of neuroblastoma suppressor genes CASZ1, CLU, RUNX3, and NGFR

Chunxi Wang et al. Cancer Res. .

Abstract

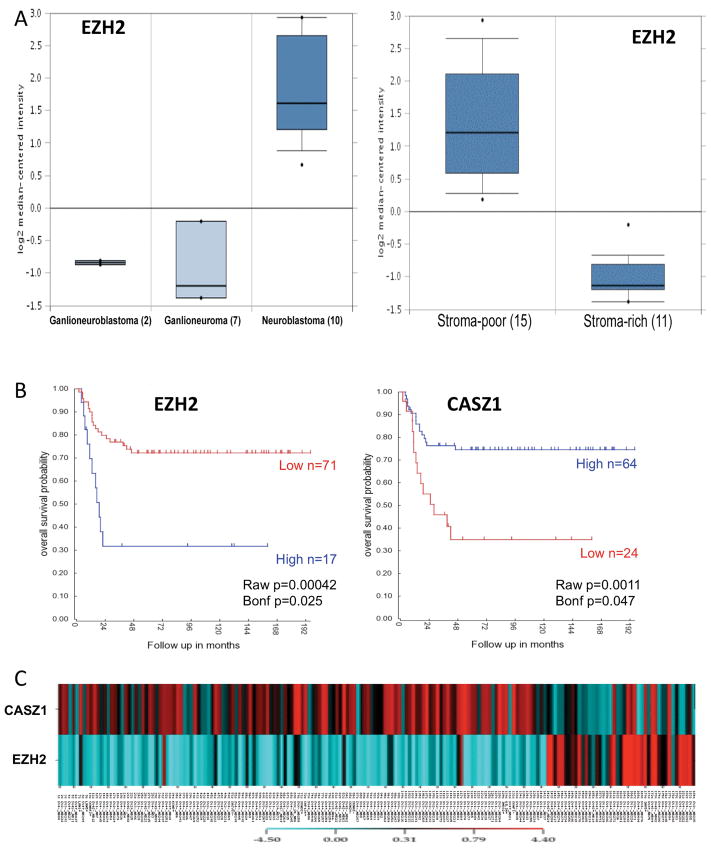
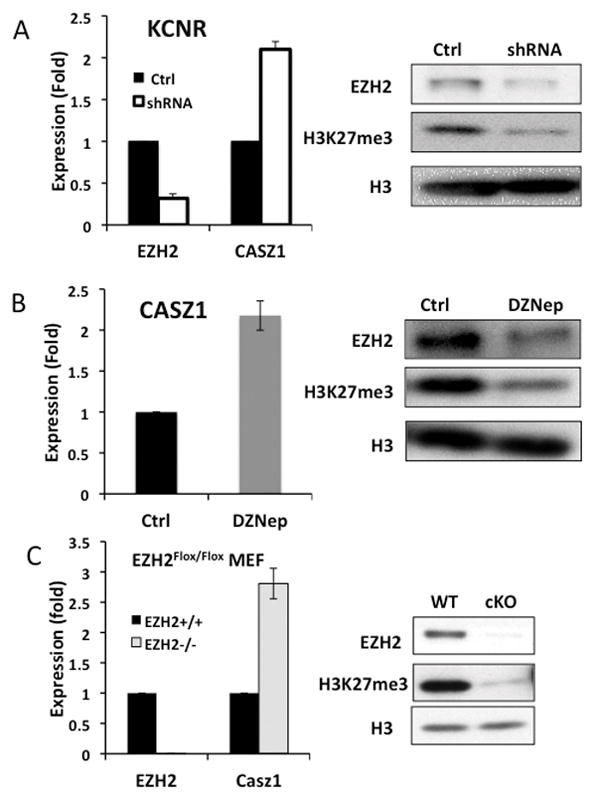
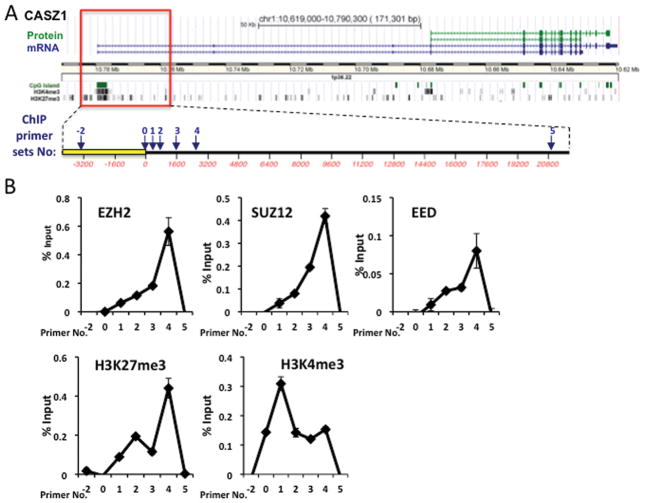
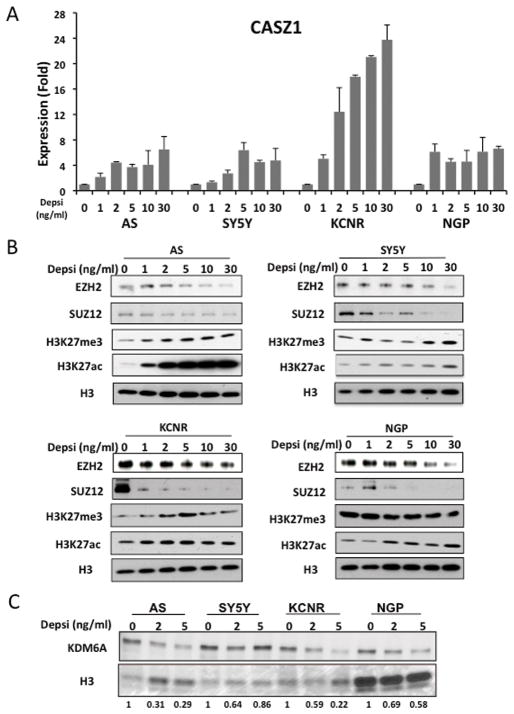
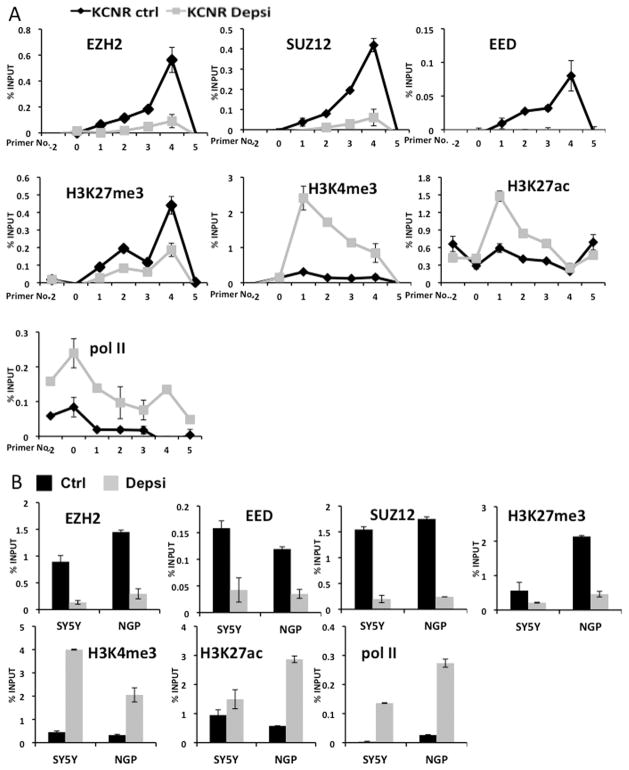
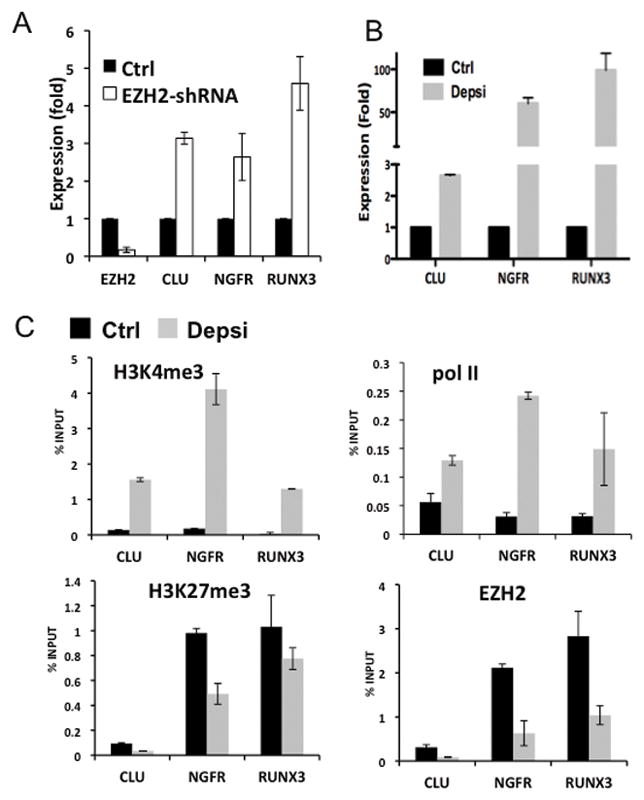
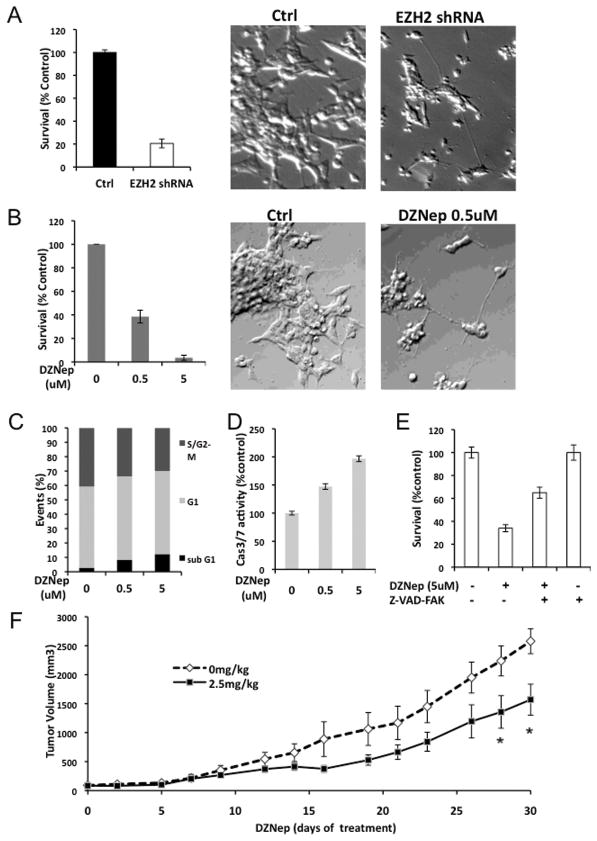
Neuroblastoma (NB) is the most common extracranial pediatric solid tumor with an undifferentiated status and generally poor prognosis, but the basis for these characteristics remains unknown. In this study, we show that upregulation of the Polycomb protein histone methyltransferase EZH2, which limits differentiation in many tissues, is critical to maintain the undifferentiated state and poor prognostic status of NB by epigenetic repression of multiple tumor suppressor genes. We identified this role for EZH2 by examining the regulation of CASZ1, a recently identified NB tumor suppressor gene whose ectopic restoration inhibits NB cell growth and induces differentiation. Reducing EZH2 expression by RNA interference-mediated knockdown or pharmacologic inhibiton with 3-deazaneplanocin A increased CASZ1 expression, inhibited NB cell growth, and induced neurite extension. Similarly, EZH2(-/-) mouse embryonic fibroblasts (MEF) displayed 3-fold higher levels of CASZ1 mRNA compared with EZH2(+/+) MEFs. In cells with increased expression of CASZ1, treatment with histone deacetylase (HDAC) inhibitor decreased expression of EZH2 and the Polycomb Repressor complex component SUZ12. Under steady-state conditions, H3K27me3 and PRC2 components bound to the CASZ1 gene were enriched, but this enrichment was decreased after HDAC inhibitor treatment. We determined that the tumor suppressors CLU, NGFR, and RUNX3 were also directly repressed by EZH2 like CASZ1 in NB cells. Together, our findings establish that aberrant upregulation of EZH2 in NB cells silences several tumor suppressors, which contribute to the genesis and maintenance of the undifferentiated phenotype of NB tumors.


Figures

Fig. 1
Fig. 1. The level of EZH2 expression predicts the clinical outcome of NB patients
A. EZH2 is highly expressed in more aggressive NB tumors comparing with the differentiated neuroblastic tumors, ganglioneuroblastoma and ganglioneuroma (Left panel, p=4.12×10⁻⁸), and high EZH2 expression is associated with stoma poor tumors (Right panel). The graph is downloaded from Oncomine microarray database. B. Kaplan-Meier survival plots were downloaded from R2 microarray analysis and visualization platform. Patients with higher EZH2 and CASZ1 expression are highlighted in blue, while patients with lower EZH2 or CASZ1 expression are highlighted in red. (EZH2, p= 0.00042; CASZ1, p=0.0011). C. EZH2 and CASZ1 expression is reverse correlated in NB clinical tumors and NB cell lines. The microarray expression data were downloaded from Oncogenomics Section Data center (http://pob.abcc.ncifcrf.gov/cgi-bin/JK). Log2 mean value is as the cut-off “0”, lower expression comparing with the mean value is negative number and colored blue, while higher is positive and colored red. The color codon is showed in color bar.
Fig. 2
Fig. 2. Genetic and pharmacologic inhibition of EZH2 expression leads to increase in CASZ1 mRNA expression
A. qRT-PCR measures the relative mRNA expression of EZH2 and CASZ1 in EZH2-shRNA-transfected KCNR (shRNA) comparing with non-target shRNA-transfected cells (Ctrl). The EZH2 protein expression and H3K27me3 status were detected by western blot. H3 served as loading control. B. SMS-KCNR cells were treated with 0.5uM DZNep for 48 hours. The mRNA expression of CASZ1 was measured using qRT-PCR, and western blot examined protein expression as indicated. C Relative mRNA expression of EZH2 and CASZ1 were measured by qRT-PCR in EZH2 knock out (EZH2−/−) and control MEF (EZH2+/+) cell lines, and western blot showed the proteins expression as indicated.
Fig. 3
Fig. 3. PRC2 complex binds to the CASZ1 promoter
A. Schematic representation of CASZ1 locus, transcripts, coded proteins, CpG islands and histone modifications, which was downloaded and modified from UCSC Genome Browser. The box frames the genomic section of CASZ1 expanded below. Numbered arrows indicate the genomic regions analyzed for PRC2 binding and histone modifications using ChIP assays. B. ChIP-PCR assays revealed the binding of PRC2 components and the indicated histone marks, at CASZ1 locus in SMS-KCNR cells under steady-state conditions. The enrichment of examined histone modifications and the PRC2 components in the indicated regions were examined by qRT-PCR and plotted relative to input DNA.
Fig. 4
Fig. 4. HDACi depsipeptide induces CASZ1 and represses PRC2 complex
A. NB cells were treated with different concentrations of depsipeptide for 24 hours. The relative CASZ1 expression is determined by qRT-PCR. B. Western blot showed the protein expression of EZH2, SUZ12 and the status of global H3K27me3 and H3K27ac after treatment with depsipeptide (24hrs). C. Western blot showed the protein expression of KDM6A after treatment with depsipeptide (24hrs). Desitometric analysis was performed using Image J. The relative expression of KDM6A (normalized to Ponceau S staining of Histone 3) in depsipeptide treated cells is normalized to the untreated control, normalized KDM6A values and expressed as relative density units (RDU).
Fig. 5
Fig. 5. ChIP analysis indicates that the binding of PRC2 complex is attenuated by HDACi depsipeptide treatment
A. SMS-KCNR cells were treated with 2ng/ml depsipeptide for 24 hours. ChIP assays reveal the relative enrichment of indicated histone marks, RNA polymerase II (pol II) and the binding of PRC2 components at the CASZ1 locus in depsipeptide treated (KCNR Depsi, grey line) or steady-state or control KCNR cells (KCNR Ctrl, black line). B. SH-SY5Y and NGP cells were treated with 2ng/ml depsipeptide for 24 hours (control, black; depsipeptide treated, grey). ChIP assays indicated the H3K27me3 status, PRC2 complex binding (primer No. 4) and H3K4me3, H3K27ac status and RNA polymerase II (pol II) binding (primer No. 1) on the CASZ1 promoter region.
Fig. 6
Fig. 6. EZH2 also directly represses expression of NB tumor suppressor genes
A. qRT-PCR measured the mRNA relative expression of EZH2, CLU, NGFR and RUNX3 in EZH2-shRNA-transfected KCNR (EZH2-shRNA) compared to non-target shRNA-transfected cells (Ctrl). B. The relative CLU, NGFR and RUNX3 expression levels after treatment of NB cells with depsipeptide or control solvent were determined by qRT-PCR. C. ChIP assays revealed the indicated histone marks, the binding of RNA polymerase II (pol II) and EZH2 at CLU, NGFR and RUNX3 promoters in depsipeptide treated (Depsi, grey) or non-treated KCNR cells (Ctrl, black).
Fig. 7
Fig. 7. Decrease of EZH2 affects the cell growth and induces the neurite growth
A. Cell survival in KCNR cells after 3-day infection with EZH2 or non-target shRNA lentivirus was assessed using a Cell-Titer Blue assay (left panel). The percentage of surviving cell was normalized by the absorbance value of the non-target shRNA infected cells (Control). Representative images (×200) of the non-target shRNA infected cells (Ctrl, middle panel), EZH2 shRNA infected cells (EZH2 shRNA, right panel). B. KCNR cells were treated with different concentration of DZNep for 96 hours. MTS assay was used to detected cell survival (left panel). The percentage of surviving cells was normalized by the absorbance value of the non-treated cells. Representative images (×200) of the non-treated cells (Ctrl, middle panel) and 0.5uM DZNep treated cells (DZNep 0.5uM, right panel). C. KCNR cells were treated with different concentration of DZNep for 96 hours. The cells were stained with propidium iodide and analyzed by flow cytometry. The data showed percentage of events in sub-G1, G1 and S/G2-M phase. D. Caspase 3/7 activities were assessed after 48 hours with different concentration of DZNep in KCNR cells. The percentage of caspase 3/7 activities was graphed after normalization to non-treated cells. E. KCNR cells were treated with 5uM DZNep in the absence or presence of 100uM pan caspase inhibitor, Z-VAD-FMK, for 72 hours. The percentage of surviving cells was graphed after normalization to untreated control. F. Mice were treated with or without DZNep (2.5mg/kg) twice a day, 3 days per week for 4 weeks. The mean tumor volumes are plotted using the SEM (standard error of the mean). The time points with significant differences (p<0.05) were indicated with asterisk.

References

    1. Maris JM, Hogarty MD, Bagatell R, Cohn SL. Neuroblastoma. Lancet. 2007;369:2106–20. - PubMed
    1. Oberthuer A, Theissen J, Westermann F, Hero B, Fischer M. Molecular characterization and classification of neuroblastoma. Future Oncol. 2009;5:625–39. - PubMed
    1. Brodeur GM. Neuroblastoma: biological insights into a clinical enigma. Nat Rev Cancer. 2003;3:203–16. - PubMed
    1. Krasnoselsky AL, Whiteford CC, Wei JS, Bilke S, Westermann F, Chen QR, et al. Altered expression of cell cycle genes distinguishes aggressive neuroblastoma. Oncogene. 2005;24:1533–41. - PubMed
    1. Caron H, van Sluis P, de Kraker J, Bokkerink J, Egeler M, Laureys G, et al. Allelic loss of chromosome 1p as a predictor of unfavorable outcome in patients with neuroblastoma. N Engl J Med. 1996;334:225–30. - PubMed

Publication types

MeSH terms