. 2012 Feb 1;31(3):640-53.
doi: 10.1038/emboj.2011.400. Epub 2011 Nov 8.

Differential regulation of motor control and response to dopaminergic drugs by D1R and D2R neurons in distinct dorsal striatum subregions

Affiliations

Differential regulation of motor control and response to dopaminergic drugs by D1R and D2R neurons in distinct dorsal striatum subregions

Pierre F Durieux et al. EMBO J. .

Abstract

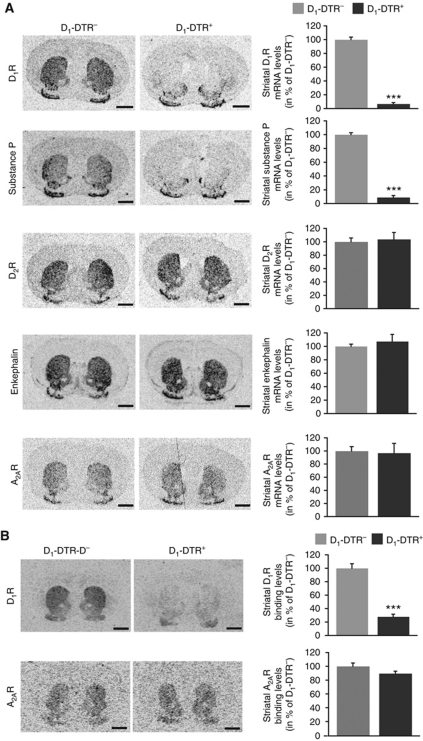
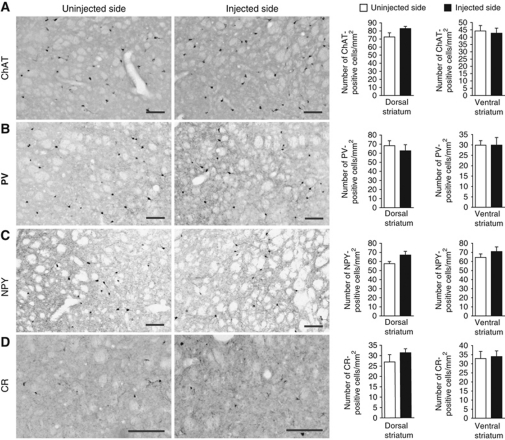
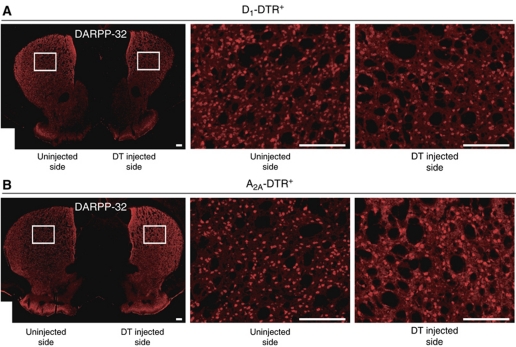
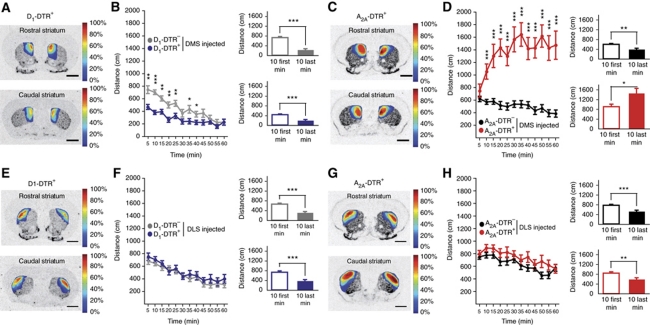
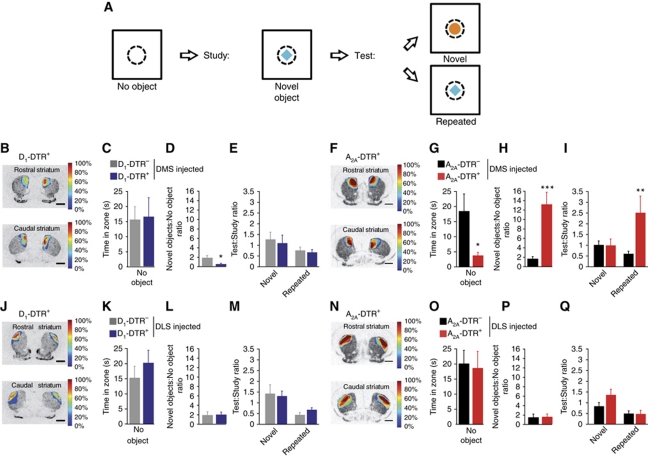
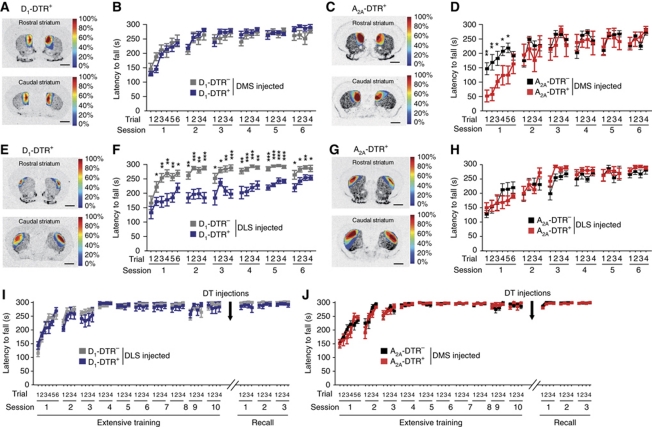
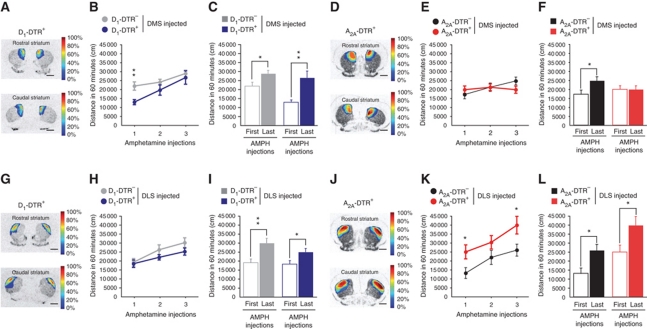
The dorsal striatum is critically involved in a variety of motor behaviours, including regulation of motor activity, motor skill learning and motor response to psychostimulant and neuroleptic drugs, but contribution of D(2)R-striatopallidal and D(1)R-striatonigral neurons in the dorsomedial (DMS, associative) and dorsolateral (DLS, sensorimotor) striatum to distinct functions remains elusive. To delineate cell type-specific motor functions of the DMS or the DLS, we selectively ablated D(2)R- and D(1)R-expressing striatal neurons with spatial resolution. We found that associative striatum exerts a population-selective control over locomotion and reactivity to novelty, striatopallidal and striatonigral neurons inhibiting and stimulating exploration, respectively. Further, DMS-striatopallidal neurons are involved only in early motor learning whereas gradual motor skill acquisition depends on striatonigral neurons in the sensorimotor striatum. Finally, associative striatum D(2)R neurons are required for the cataleptic effect of the typical neuroleptic drug haloperidol and for amphetamine motor response sensitization. Altogether, these data provide direct experimental evidence for cell-specific topographic functional organization of the dorsal striatum.


Conflict of interest statement

The authors declare that, except for income received from our primary employer, no financial support or compensation has been received from any individual or corporate entity over the past 3 years for research or professional service and there are no personal financial holdings that could be perceived as constituting a potential conflict of interest.

Figures

Figure 1
Figure 1
Characterization of D1R-striatonigral neuron ablation after full striatum DT injections in D1-DTR+ mice. (A) In-situ hybridization autoradiograms (coronal sections, level +1.2 mm relative to bregma) of D1R-striatonigral (D1R, SP) and D2R-striatopallidal (D2R, Enk and A2AR) neuron mRNAs and respective levels in the striatum of D1-DTR and D1-DTR+ mice 2 weeks after bilateral full DT injections (n=6 per group). (B) Autoradiograms (coronal sections, level +1.2 mm relative to bregma) of D1 and A2A receptors and respective striatal binding levels of D1-DTR and D1-DTR+ mice 2 weeks after bilateral full striatum DT injections (n=5–6 per group). Scale bars=1 mm. Data are reported as mean±s.e.m. ***P<0.001.
Figure 2
Figure 2
Preservation of striatal interneurons after ablation of striatonigral neurons in D1-DTR+ mice. (AD) Immunostaining and quantitative analysis of (A) choline acetyltransferase (ChAT), (B) parvalbumin (PV), (C) neuropeptide Y (NPY) and (D) calretinin (CR)-positive cells in full DT-injected striatum as compared with uninjected striatum of D1-DTR+ mice (day 22 after unilateral full DT injections). Scale bars=100 μm. Columns represent the mean±s.e.m. (n=7).
Figure 3
Figure 3
Reduction of striatal DARPP-32-positive neurons in DT-injected D1-DTR+ or A2A-DTR+ mice. (A, B) DARPP-32 immunostaining 1 month after unilateral DT injection in the entire striatum showing a 44.5±2.5 and 42.9±2.62% reduction of DARPP-32-positive cells in the injected striatum as compared with the uninjected striatum of D1-DTR+ (A) (6870±244 cells versus 3807±40 cells, n=2) and A2A-DTR+ (B) (6046±1094 cells versus 3481.5±783.5 cells, n=2) mice, respectively. Scale bars=200 μm.
Figure 4
Figure 4
Motor activity and rotarod learning in D1R and D2R MSN full ablation mice. (A, B) In-situ hybridization for substance P (SP) (A) and enkephalin (Enk) (B) mRNA and respective quantitation, in rostral (bregma +1.2 mm) and caudal (bregma −0.1 mm) coronal brain sections of full striatum DT-injected D1-DTR/D1-DTR+ (A) and A2A-DTR/A2A-DTR+ (B) mice. Data are expressed as optical density values of the injected striatum in DTR+ as a percentage of the respective DTR mice. Scale bars represent 1 mm. (C, E) Locomotor activity over 60 min in an open field of D1-DTR+ (C) and A2A-DTR+ (E) mice, and respective controls, 1 week after full DT injections. (D, F) Rotarod performance in D1-DTR/D1-DTR+ (D) and A2A-DTR/A2A-DTR+ (F) mice 1 week after full DT injections (n=6–10 per group). (G, H) Ten days of rotarod training and three days of performance recall one week after full DT injections in D1-DTR/D1-DTR+ (G) and A2A-DTR/A2A-DTR+ (H) mice (n=6–8 per group). Data are reported as mean±s.e.m. Statistical comparisons were made between DTR+ and respective DTR control mice. *P<0.05, **P<0.01, ***P<0.001.
Figure 5
Figure 5
Ablation of D1R and D2R MSNs in the dorsomedial (DMS) or dorsolateral (DLS) striatum. (AD) In-situ hybridization and quantitation of substance P (SP) (A, C) and enkephalin (Enk) (B, D) mRNA in rostral (bregma +1.2 mm) and caudal (bregma −0.1 mm) coronal brain sections of DMS (A, B) or DLS (C, D) DT-injected D1-DTR/D1-DTR+ (A, C) and A2A-DTR/A2A-DTR+ (B, D) mice (topographical representation of lesions can be found on Figure 6A, C, E and G). Data are expressed as optical density values of the injected striatum in DTR+ as a percentage of respective DTR mice. Scale bars represent 1 mm. Data are reported as mean±s.e.m. (n=7–9 per group). Statistical comparisons were made between DTR+ and respective DTR control mice. *P<0.05, ***P<0.001.
Figure 6
Figure 6
Locomotor behaviour after ablation of D1R or D2R MSNs in the dorsomedial (DMS) or dorsolateral (DLS) striatum. (A, C, E, G) Topographic representation of the lesioned areas in D1-DTR+ (A, E) and A2A-DTR+ (C, G) DT-injected mice into the DMS (A, C) or the DLS (E, G). Colours represent percent of superimposed lesioned areas. (B, D, F, H) Locomotion of DMS DT-injected D1-DTR+ (B) and A2A-DTR+ (D) or DLS DT-injected D1-DTR+ (F) and A2A-DTR+ (H) mice, and respective controls over 60 min in an open field; histograms represent mean ambulation during the first 10 min and the 10 last minutes of the open field. Data are reported as mean±s.e.m. (n=19–28 per group). Statistical comparisons were made between DTR+ and respective DTR control mice (dot chart) or between first and last open field 10 min for the same genotype (histograms). *P<0.05, **P<0.01, ***P<0.001.
Figure 7
Figure 7
Object recognition task of DMS or DLS D1R- and D2R-MSN ablated mice. (A) Decoupled delayed spontaneous object recognition task, in which time spent in an open field core zone (dot line) is recorded without object, with novel object or repeated object. (B, F, J, N) Topographic representation of the lesioned areas in D1-DTR+ (B, J) and A2A-DTR+ (F, N) DT-injected mice into the DMS (B, F) or the DLS (J, N). Colours represent percent of superimposed lesioned areas. (CE, GI, KM, OQ) Time spent in the open field core in the absence of object (C, G, K, O), time spent in open field core in the presence of novel objects divided by the time spent in the open field core without object (D, H, L, P) and time spent in the open field core during the test phase divided by time spent in the open field core during the study phase in novel or repeated conditions (F, I, M, Q) of DMS D1-DTR (CE) and A2A-DTR (GI) or DLS D1-DTR (KM) and A2A-DTR (OQ) DT-injected mice. Data are reported as mean±s.e.m. (n=6–10 per group). Statistical comparisons were made as described in Materials and methods. *P<0.05, **P<0.01, ***P<0.001.
Figure 8
Figure 8
Rotarod performance after ablation of D1R and D2R MSNs in the DMS or DLS. (A, C, E, G) Topographic representation of the lesioned areas in D1-DTR+ (A, E) and A2A-DTR+ (C, G) DT-injected mice into the DMS (A, D) or the DLS (E, G). Colours represent percent of superimposed lesioned areas. (B, D, F, H) Rotarod performance of DMS D1-DTR+ (B) and A2A-DTR+ (D) and DLS D1-DTR+ (F) and A2A-DTR+ (H) DT-injected mice and respective controls. (I, J) Ten days of rotarod training and three days of performance recall one week after DT injections in DLS of D1-DTR (I) and DMS of A2A-DTR (J) mice; respective topographic representation of the lesioned areas can be found on Figure 5F and J. Data are reported as mean±s.e.m. (n=7–9 per group). Statistical comparisons were made between DTR+ and respective DTR control mice. *P<0.05, **P<0.01, ***P<0.001.
Figure 9
Figure 9
Haloperidol-induced immobility and catalepsy in mice lacking D1R or D2R MSNs in the DMS or DLS. (A, B, D, E, G, H, J, K) Locomotor activity in a 60-min open field after saline or haloperidol (1.5 mg/kg) administration in DMS D1-DTR (A, B) and A2A-DTR (D, E) or DLS D1-DTR (G, H) and A2A-DTR (J, K) DT-injected mice. (C, F, I, L) Catalepsy score (latency to move) 30 min after haloperidol (1.5 mg/kg) administration in D1-DTR+ (C, I) and A2A-DTR+ (F, L) DT-injected mice into the DMS (C, F) or the DLS (I, L). Respective topographic representation of the lesioned areas can be found on Figure 5B, F, J and N. Data are reported as mean±s.e.m. (n=6–11 per group). Statistical comparisons were made between haloperidol and saline treatment (dot chart) or DTR+ and respective DTR control mice (histograms). *P<0.05, **P<0.01, ***P<0.001.
Figure 10
Figure 10
Amphetamine locomotor sensitization after D1R or D2R MSN ablation in the DMS or DLS. (A, D, G, J) Topographic representation of the lesioned areas in D1-DTR+ (A, G) and A2A-DTR+ (D, J) DT-injected mice into the DMS (A, D) or the DLS (G, J). Colours represent percent of superimposed lesioned areas. (B, C, E, F, H, I, K, L) Locomotor activity in a 60-min open field after repeated d-amphetamine (3 mg/kg) administration in DMS D1-DTR (B, C) and A2A-DTR (E, F) or DLS D1-DTR (H, I) and A2A-DTR (K, L) DT-injected mice. Histograms represent ambulation following first and last d-amphetamine administration. Data are reported as mean±s.e.m. (n=10–17 per group). Statistical comparisons were made between DTR+ and respective DTR control mice (dot chart) or between first and last amphetamine injection (histograms). *P<0.05, **P<0.01.

References

    1. Ashby FG, Turner BO, Horvitz JC (2010) Cortical and basal ganglia contributions to habit learning and automaticity. Trends Cogn Sci 14: 208–215 - PMC - PubMed
    1. Bateup HS, Santini E, Shen W, Birnbaum S, Valjent E, Surmeier DJ, Fisone G, Nestler EJ, Greengard P (2010) Distinct subclasses of medium spiny neurons differentially regulate striatal motor behaviors. Proc Natl Acad Sci USA 107: 14845–14850 - PMC - PubMed
    1. Bateup HS, Svenningsson P, Kuroiwa M, Gong S, Nishi A, Heintz N, Greengard P (2008) Cell type-specific regulation of DARPP-32 phosphorylation by psychostimulant and antipsychotic drugs. Nat Neurosci 11: 932–939 - PMC - PubMed
    1. Bearzatto B, Servais L, Cheron G, Schiffmann SN (2005) Age dependence of strain determinant on mice motor coordination. Brain Res 1039: 37–42 - PubMed
    1. Beaulieu JM, Gainetdinov RR (2011) The physiology, signaling, and pharmacology of dopamine receptors. Pharmacol Rev 63: 182–217 - PubMed

Publication types

LinkOut - more resources