. 2011 Nov 8:7:544.
doi: 10.1038/msb.2011.71.

Systematic exploration of synergistic drug pairs

Affiliations

Systematic exploration of synergistic drug pairs

Murat Cokol et al. Mol Syst Biol. .

Abstract

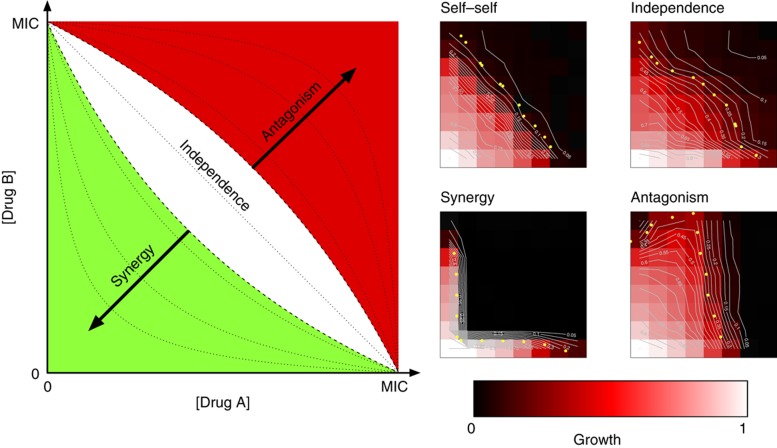
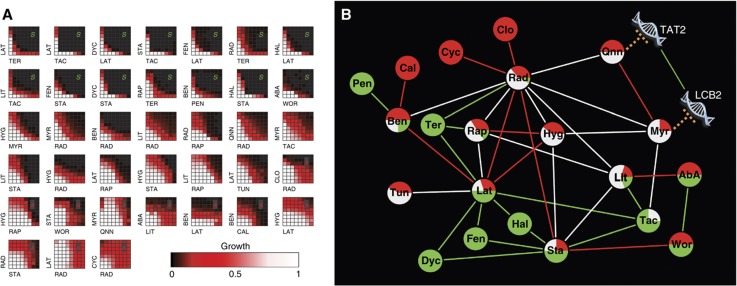
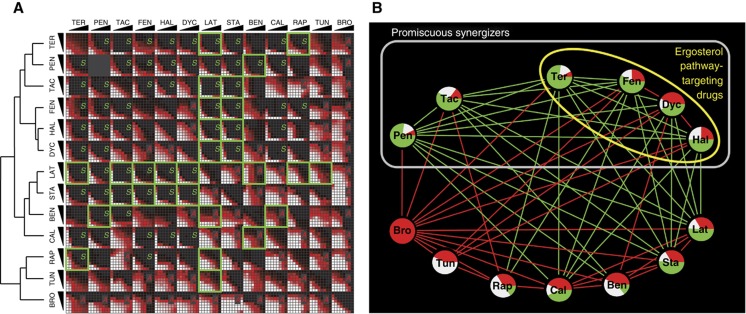
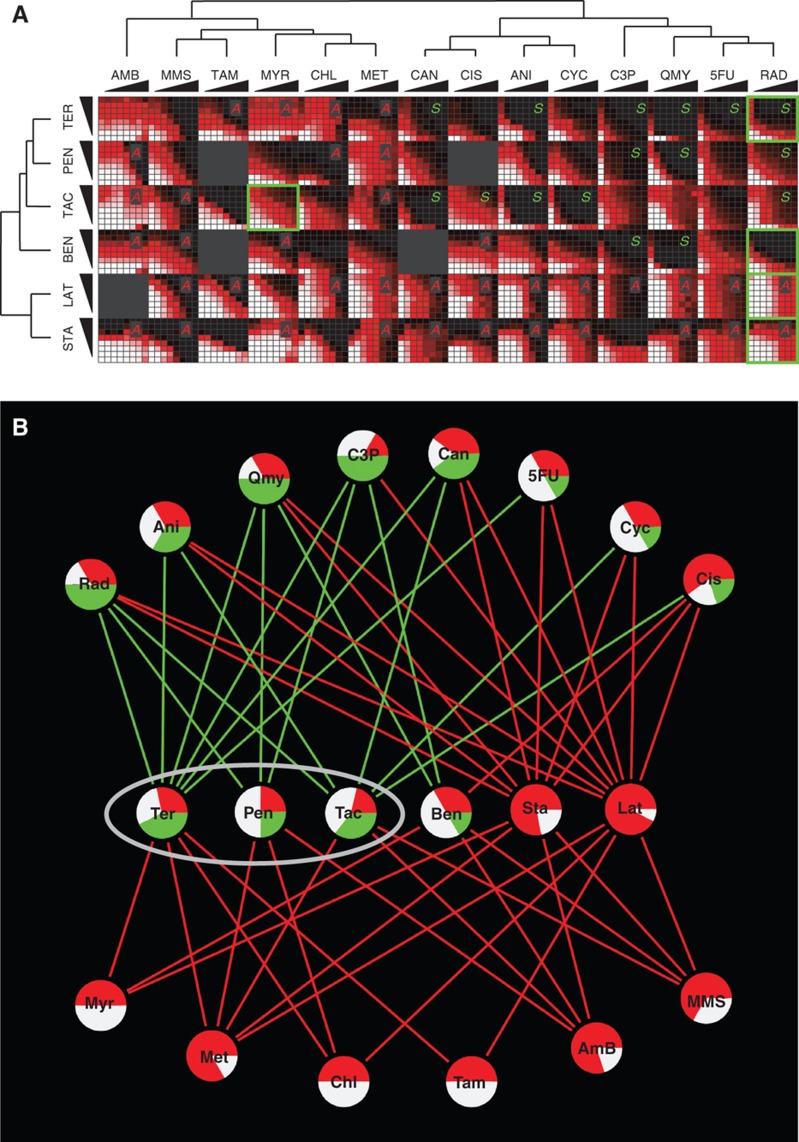
Drug synergy allows a therapeutic effect to be achieved with lower doses of component drugs. Drug synergy can result when drugs target the products of genes that act in parallel pathways ('specific synergy'). Such cases of drug synergy should tend to correspond to synergistic genetic interaction between the corresponding target genes. Alternatively, 'promiscuous synergy' can arise when one drug non-specifically increases the effects of many other drugs, for example, by increased bioavailability. To assess the relative abundance of these drug synergy types, we examined 200 pairs of antifungal drugs in S. cerevisiae. We found 38 antifungal synergies, 37 of which were novel. While 14 cases of drug synergy corresponded to genetic interaction, 92% of the synergies we discovered involved only six frequently synergistic drugs. Although promiscuity of four drugs can be explained under the bioavailability model, the promiscuity of Tacrolimus and Pentamidine was completely unexpected. While many drug synergies correspond to genetic interactions, the majority of drug synergies appear to result from non-specific promiscuous synergy.


Conflict of interest statement

MC1, HNC, and FPR have filed a US patent application on synergistic antifungal drug combinations discovered in the course of this study.

Figures

Figure 1
Figure 1
Experimental set-up for classification of drug interactions. For each drug pair, growth rates were measured for all pairwise combinations of seven drug concentrations, linearly increasing from 0 to the minimal inhibitory concentration (MIC). ‘Isophenotypic’ curves describing drug concentration combinations which yield the same phenotype are shown on the left. Isophenotypic curves are expected to be parallel to the diagonal for independent drug pairs, concave for synergistic drug pairs, and convex for antagonistic drug pairs, according to Loewe additivity. For each drug pair, a drug interaction score (α) quantifying the concavity of the isophenotypic curve was computed, with α=0 defining independence and α taking negative or positive values when drugs are synergistic or antagonistic, respectively. Measurement error in α was assessed by examining the distribution of α for 25 self–self drug combinations, and drug pairs that had significantly smaller or larger α values were classified as synergistic or antagonistic, respectively. The white region shows the margin of variability between self–self interactions (−0.78< α<0.68, 95% confidence interval). Experimental examples of drug interactions are given on the right. In each example, Tacrolimus concentration is increased along the x axis. Drugs used in increasing concentrations along the y axis are Tacrolimus for self–self, Myriocin for independence, Latrunculin B for synergy, and Bromopyruvate for antagonism. For each example, sample isophenotypic curves are depicted in white. Yellow dots mark the longest isophenotypic curve, which was used to classify a drug interaction. See Supplementary Figure 1 for plots of all 200 pairwise drug interaction tests conducted in the course of this study.
Figure 2
Figure 2
Synergy tests between 38 drug pairs that target proteins encoded by synergistic genes. (A) Drug pairs were combined in 8 × 8 matrices where the concentration of one drug was linearly increased along each axis. The lowest concentration was 0 and the highest concentration was chosen close to the MIC for each drug. Fourteen drug pairs showed significant synergy (marked with S) while eleven were significantly antagonistic (marked with A). Thirteen drug pairs yielded scores that fell within the distribution observed for self–self drug pairs, and were classified as independent (unmarked). (B) Network representation of the drug interactions shown in (A). Edges reflect the interaction type between two drugs and the node pie charts represent the ratio of different types of interactions each drug has in this data set (green: synergy, white: independent; red: antagonism). For drug name abbreviations, see Table I. One example for drug synergy prediction using synergistic genetic interactions: MYR targets Lcb2 and QNN targets Tat2 is also shown. There is a known synergistic genetic interaction between LCB2 and TAT2, which predicts that MYR and QNN will be synergistic according to the parallel pathway inhibition model of drug synergy. However, these drugs were found to be antagonistic.
Figure 3
Figure 3
Synergy tests between all pairs among 13 drugs. (A) Drug pairs were combined in 8 × 8 matrices where the concentration of one drug was linearly increased along each axis. Green squares correspond to drug pairs that target proteins encoded by synergistic genes. We found 32 significant synergies (S) and 27 significant antagonisms (A) among the 78 drug–drug interactions tested. Hierarchical clustering of drug interaction score profiles is shown on the left. (B) Network representation of the synergistic and antagonistic drug interactions shown in (A). Edges reflect the interaction type between two drugs and the node pie charts represent the ratio of different types of interactions each drug has in this data set (green: synergy, white: independent; red: antagonism; independence edges are omitted for clarity). Gray box indicates the promiscuous synergizers learned from the drug interaction network in this figure. Yellow circle shows the drugs that target the ergosterol pathway in yeast. For drug name abbreviations, see Table I.
Figure 4
Figure 4
Synergy tests between 6 drugs (3 predicted to be promiscuous synergizers and 3 predicted to be chaste synergizers) and 14 arbitrarily chosen drugs. (A) Drug pairs were combined in 8 × 8 matrices where the concentration of one drug was linearly increased along each axis. Promiscuous synergizers (top three rows) showed 14 synergies (S) while chaste synergizers (bottom three rows) showed 2 synergies. Thirty-seven significant drug antagonisms (A) were observed, predominantly involving chaste synergizers. Green squares correspond to drug pairs that target proteins encoded by synergistic genes. Hierarchical clusterings of drug interaction score profiles are shown on the left and top. (B) Network representation of the synergy and antagonism drug interactions shown in (A). Edges reflect the interaction type between two drugs and the node pie charts represent the ratio of different types of interactions each drug has in this data set (green: synergy, white: independent; red: antagonism; independence edges are omitted for clarity). Gray circle indicates the promiscuous synergizers learned from the drug interaction network in Figure 3B. For drug name abbreviations, see Table I.

Similar articles

Cited by

References

    1. Akima H (1970) A new method of interpolation and smooth curve fitting based on local procedures. J ACM 17: 589–602
    1. Azmi AS, Wang Z, Philip PA, Mohammad RM, Sarkar FH (2010) Proof of concept: network and systems biology approaches aid in the discovery of potent anticancer drug combinations. Mol Cancer Ther 9: 3137–3144 - PMC - PubMed
    1. Baryshnikova A, Costanzo M, Kim Y, Ding H, Koh J, Toufighi K, Youn JY, Ou J, San Luis BJ, Bandyopadhyay S, Hibbs M, Hess D, Gingras AC, Bader GD, Troyanskaya OG, Brown GW, Andrews B, Boone C, Myers CL (2010) Quantitative analysis of fitness and genetic interactions in yeast on a genome scale. Nat Methods 7: 1017–1024 - PMC - PubMed
    1. Berenbaum MC (1989) What is synergy? Pharmacol Rev 41: 93–141 - PubMed
    1. Bollenbach T, Quan S, Chait R, Kishony R (2009) Nonoptimal microbial response to antibiotics underlies suppressive drug interactions. Cell 139: 707–718 - PMC - PubMed

Publication types

MeSH terms