

Deep proteome and transcriptome mapping of a human cancer cell line
- PMID: 22068331
- PMCID: PMC3261714
- DOI: 10.1038/msb.2011.81
Deep proteome and transcriptome mapping of a human cancer cell line
Abstract
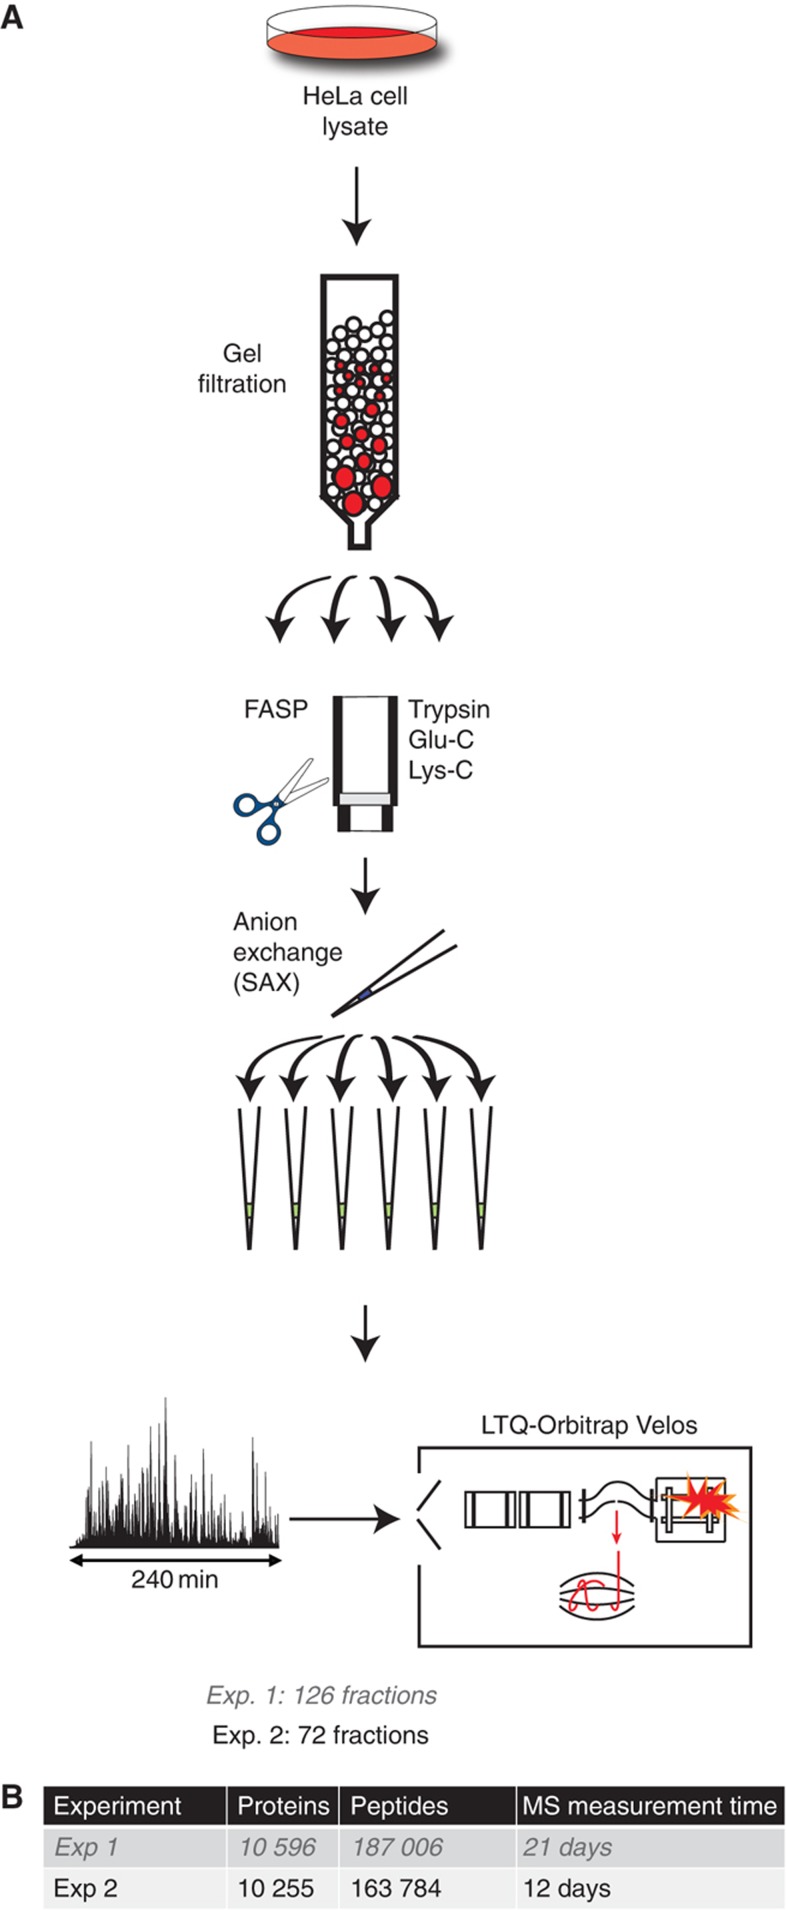
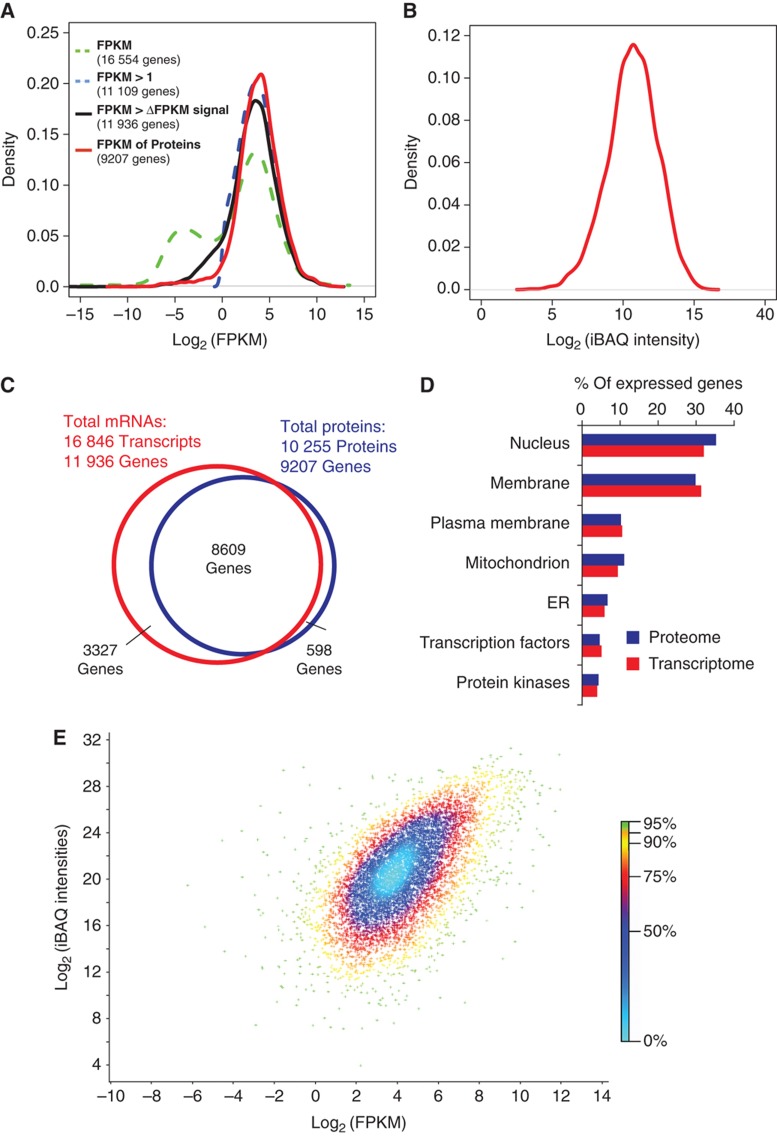
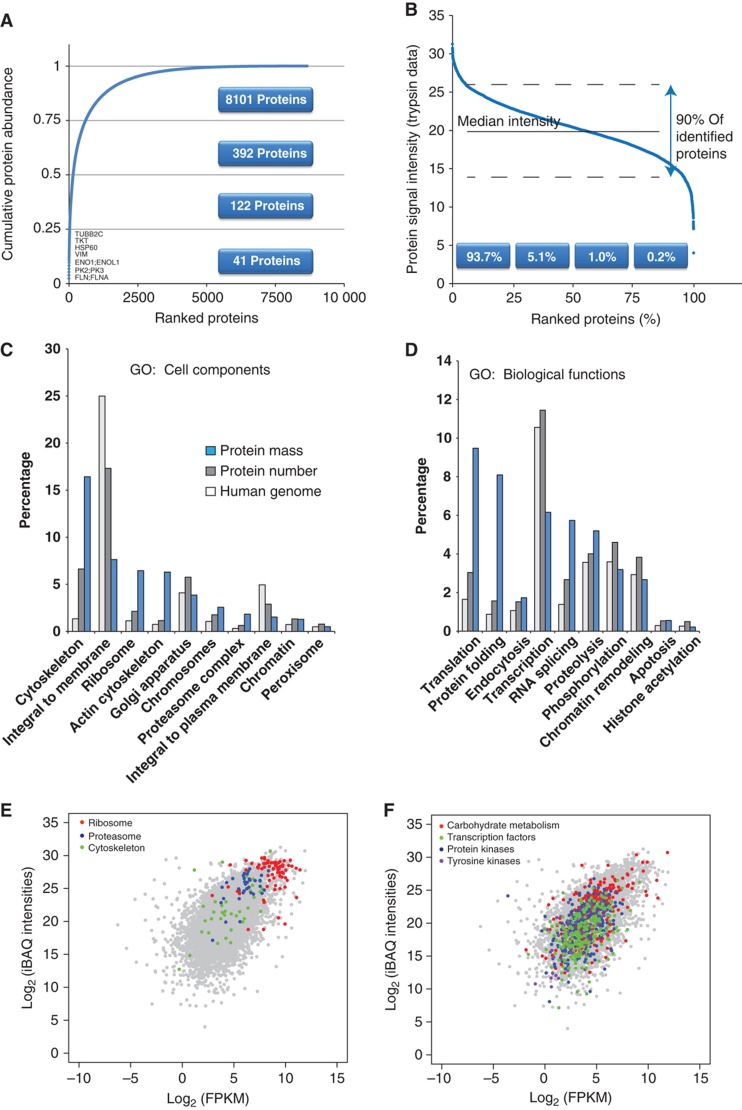
While the number and identity of proteins expressed in a single human cell type is currently unknown, this fundamental question can be addressed by advanced mass spectrometry (MS)-based proteomics. Online liquid chromatography coupled to high-resolution MS and MS/MS yielded 166 420 peptides with unique amino-acid sequence from HeLa cells. These peptides identified 10 255 different human proteins encoded by 9207 human genes, providing a lower limit on the proteome in this cancer cell line. Deep transcriptome sequencing revealed transcripts for nearly all detected proteins. We calculate copy numbers for the expressed proteins and show that the abundances of > 90% of them are within a factor 60 of the median protein expression level. Comparisons of the proteome and the transcriptome, and analysis of protein complex databases and GO categories, suggest that we achieved deep coverage of the functional transcriptome and the proteome of a single cell type.
Conflict of interest statement
The authors declare that they have no conflict of interest.
Figures
References
-
- Aebersold R, Mann M (2003) Mass spectrometry-based proteomics. Nature 422: 198–207 - PubMed
-
- Ashburner M, Ball CA, Blake JA, Botstein D, Butler H, Cherry JM, Davis AP, Dolinski K, Dwight SS, Eppig JT, Harris MA, Hill DP, Issel-Tarver L, Kasarskis A, Lewis S, Matese JC, Richardson JE, Ringwald M, Rubin GM, Sherlock G (2000) Gene ontology: tool for the unification of biology. The Gene Ontology Consortium. Nat Genet 25: 25–29 - PMC - PubMed
-
- Cox J, Mann M (2008) MaxQuant enables high peptide identification rates, individualized p.p.b.-range mass accuracies and proteome-wide protein quantification. Nat Biotechnol 26: 1367–1372 - PubMed
-
- Cox J, Mann M (2011) Quantitative, high-resolution proteomics for data-driven systems biology. Annu Rev Biochem 80: 273–299 - PubMed
Publication types
MeSH terms
Substances
LinkOut - more resources
Full Text Sources
Other Literature Sources
Molecular Biology Databases
Research Materials
