. 2011 Nov 8:7:549.
doi: 10.1038/msb.2011.82.

The quantitative proteome of a human cell line

Affiliations

The quantitative proteome of a human cell line

Martin Beck et al. Mol Syst Biol. .

Abstract

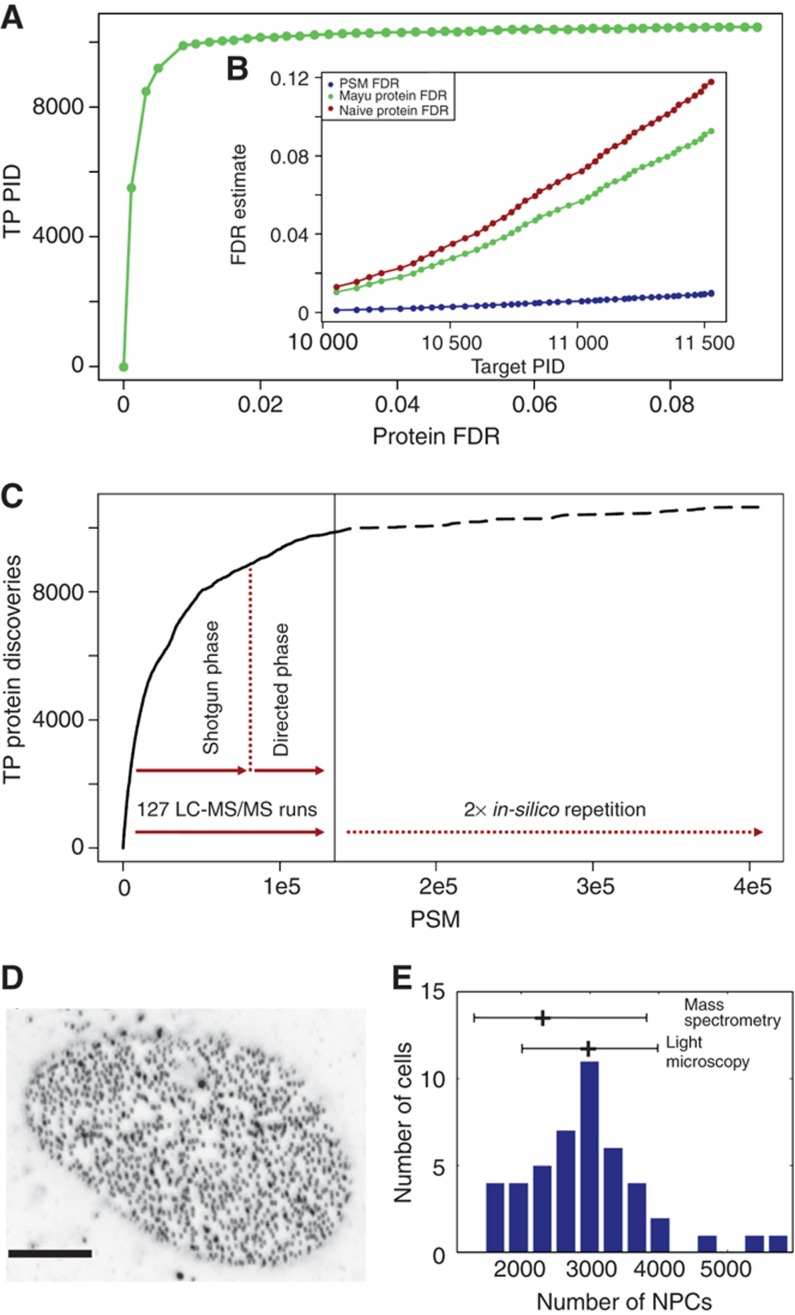
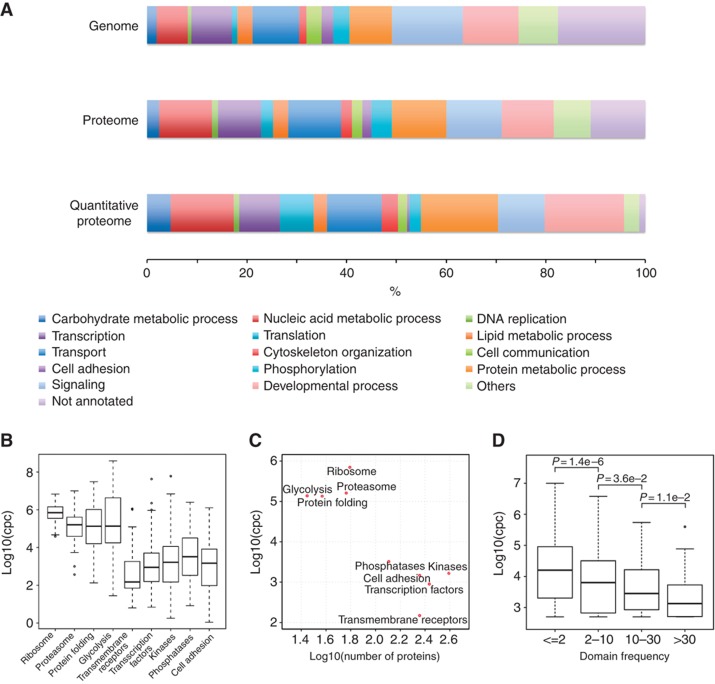
The generation of mathematical models of biological processes, the simulation of these processes under different conditions, and the comparison and integration of multiple data sets are explicit goals of systems biology that require the knowledge of the absolute quantity of the system's components. To date, systematic estimates of cellular protein concentrations have been exceptionally scarce. Here, we provide a quantitative description of the proteome of a commonly used human cell line in two functional states, interphase and mitosis. We show that these human cultured cells express at least -10 000 proteins and that the quantified proteins span a concentration range of seven orders of magnitude up to 20 000 000 copies per cell. We discuss how protein abundance is linked to function and evolution.


Conflict of interest statement

The authors declare that they have no conflict of interest.

Figures

Figure 1
Figure 1
Protein and PSM FDRs for the ‘U2OS data set’ and independent validation of protein copy numbers. (A) Number of expected true positive protein identifications (TP PIDs) for varying protein FDRs. Number of PIDs stagnates at 2% protein FDR (∼0.2% PSM FDR). Stringent PSM filter preserves true PIDs. (B) FDR estimates for different entities as a function of the number of total, i.e., true and false PIDs (target PID). PSM FDR (blue), Mayu protein FDR (green) and the (frequently used and yet) too pessimistic naive protein FDR (Reiter et al, 2009; see Supplementary information for detail) estimate (brown). (C) Proteome coverage prediction (dashed) for repetition of experiments that gave rise to the ‘U2OS data set’ (solid). Number of acquired confident PSMs is plotted against the number of true positive protein discoveries (TP PIDs). Effective saturation coverage reached at level of TP PIDs for given experimental set-up. (D) Confocal section of U2OS cell with punctuate pattern of NPCs stained with monoclonal antibody mAb414 (scale bar 5 μm). (E) Distribution of number of NPCs in U2OS cells as determined by quantification of images from 46 cells as shown in (D). The mean value of 3000 NPCs per cell and the standard deviation of 1000 is displayed and put into relation to the number of NPCs per cell measured by MS and the corresponding precision of the MS method (mean fold error <2; Supplementary Figure S1).
Figure 2
Figure 2
Abundance levels of functional protein categories. (A) The fraction of predicted gene models or detected gene products, respectively, functioning in specific biological processes is shown in percent on the genome, qualitative, and quantitative proteome levels. Processes such as signaling and cell adhesion are underrepresented in the quantitative proteome, while processes such as protein and nucleic acid metabolism, development, cytoskeleton, translation, and carbohydrate metabolism are overrepresented in the total protein amount of U2OS cells. GO was used to categorize genes and gene products; protein copy numbers within each group were considered in case of the quantitative proteome. (B) The abundance of proteins of different molecular functions and functioning together in distinct protein complexes or biological processes varies over several orders of magnitude. (C) The median protein abundance of the functional groups shown in (B) shows a moderate inverse correlation with the number of proteins per group. (D) The frequency of protein domains in the human genome negatively correlates with their median abundance. P-values were calculated using an one-sided Wilcoxon rank sum test.
Figure 3
Figure 3
Comparative analysis of protein abundance. Pie charts representing the annotated quantitative proteome of human U2OS cells, mouse NIH3T3 cells, S. cerevisiae and L. interrogans taking protein copy numbers per functional category into account. Functional categories are classified into three major groups: cellular core, regulatory functions and others. Protein abundance data sets were taken from this study and references (Ghaemmaghami et al, 2003; Malmstrom et al, 2009; Schwanhausser et al, 2011).

References

    1. Ashburner M, Ball CA, Blake JA, Botstein D, Butler H, Cherry JM, Davis AP, Dolinski K, Dwight SS, Eppig JT, Harris MA, Hill DP, Issel-Tarver L, Kasarskis A, Lewis S, Matese JC, Richardson JE, Ringwald M, Rubin GM, Sherlock G (2000) Gene ontology: tool for the unification of biology. The Gene Ontology Consortium. Nat Genet 25: 25–29 - PMC - PubMed
    1. Beck M, Malmstrom JA, Lange V, Schmidt A, Deutsch EW, Aebersold R (2009) Visual proteomics of the human pathogen Leptospira interrogans. Nat Methods 6: 817–U855 - PMC - PubMed
    1. Bodenmiller B, Wanka S, Kraft C, Urban J, Campbell D, Pedrioli PG, Gerrits B, Picotti P, Lam H, Vitek O, Brusniak MY, Roschitzki B, Zhang C, Shokat KM, Schlapbach R, Colman-Lerner A, Nolan GP, Nesvizhskii AI, Peter M, Loewith R et al. (2010) Phosphoproteomic analysis reveals interconnected system-wide responses to perturbations of kinases and phosphatases in yeast. Sci Signal 3: rs4. - PMC - PubMed
    1. Claassen M, Aebersold R, Buhmann JM (2009) Proteome coverage prediction with infinite Markov models. Bioinformatics 25: i154–i160 - PMC - PubMed
    1. Claassen M, Aebersold R, Buhmann JM (2011) Proteome coverage prediction for integrated proteomics datasets. J Comput Biol 18: 283–293 - PubMed

Publication types