. 2011 Dec 6;105(12):1885-93.
doi: 10.1038/bjc.2011.452. Epub 2011 Nov 8.

E/N-cadherin switch mediates cancer progression via TGF-β-induced epithelial-to-mesenchymal transition in extrahepatic cholangiocarcinoma

Affiliations

E/N-cadherin switch mediates cancer progression via TGF-β-induced epithelial-to-mesenchymal transition in extrahepatic cholangiocarcinoma

K Araki et al. Br J Cancer. .

Abstract

Background: Epithelial-to-mesenchymal transition (EMT) is a fundamental process governing not only morphogenesis in multicellular organisms, but also cancer progression. During EMT, epithelial cadherin (E-cadherin) is downregulated while neural cadherin (N-cadherin) is upregulated, referred to as 'cadherin switch'. This study aimed to investigate whether cadherin switch promotes cancer progression in cholangiocarcinoma (CC).

Methods: CC cell lines were examined for migration, invasion, and morphological changes with typical EMT-induced model using recombinant TGF-β1. The changes in E-cadherin and N-cadherin expression were investigated during EMT. We also examined E-cadherin and N-cadherin expression in resected specimens from extrahepatic CC patients (n=38), and the associations with clinicopathological factors and survival rates.

Results: TGF-β1 treatment activated cell migration, invasion, and fibroblastic morphological changes, especially in extrahepatic CC HuCCT-1 cells. These changes occurred with E-cadherin downregulation and N-cadherin upregulation, that is, cadherin switch. Patients with low E-cadherin expression had a significantly lower survival rate than patients with high E-cadherin expression (P=0.0059). Patients with decreasing E-cadherin and increasing N-cadherin expression had a significantly lower survival rate than patients with increasing E-cadherin and decreasing N-cadherin expression (P=0.017).

Conclusion: Cadherin switch promotes cancer progression via TGF-β-induced EMT in extrahepatic CC, suggesting a target for elucidating the mechanisms of invasion and metastasis in extrahepatic CC.


Figures
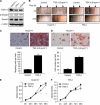
Figure 1
Figure 1
TGF-β1 signalling molecule expression and biological activity of rTGF-β1 in CC cells. (A) Expression of TGF-β molecules in CC cells. Total cell extracts were separated by SDS–PAGE using 12% gels, and probed with polyclonal antibodies against TGF-β1, phospho-Smad2, and Smad4 to detect their expression. (B) Representative examples of wounding experiments in HuCCT-1 and TFK-1 cells cultured with or without rTGF-β1 (5 ng ml−1). HuCCT-1 and TFK-1 cells were wounded (time 0) and maintained for 24 h in conditioned medium with or without rTGF-β1 (5 ng ml−1). The arrows point to the edges of the wounds. After 24 h, the wound healing is faster in rTGF-β1-treated cells than in untreated cells in both cell lines. (C) Migration assays. The mean cell counts (±s.e.m.; n=10) of cells that migrated through the pores to the lower surface are shown. HuCCT-1 cells with or without rTGF-β1 treatment were tested for migration using a modified Boyden chamber. *P<0.05 vs control cells. (D) Invasion assays. The mean cell counts (±s.e.m.; n=10) of HuCCT-1 cells that invaded through the pores to the lower surface are shown. *P<0.05 vs control cells. (E and F) Proliferation assays. The mean optical densities (±s.e.m.; n=3) of the CC cells are shown. HuCCT-1 and TFK-1 cells were cultured on 96-wells with or without rTGF-β1 (5 ng ml−1). The reagent was injected after 0, 24, 48, 72 or 96 h of culture and the cells were incubated for a further 2 h. The optical densities were detected using a microplate reader. *P<0.05 vs 0 h.
Figure 2
Figure 2
Immunocytochemical analysis of changes in actin filaments in HuCCT-1 and TFK-1 cells in response to rTGF-β1 treatment. HuCCT-1 and TFK-1 cells were incubated with rTGF-β1 (5 ng ml−1) for 24 h. Actin filaments were stained with Alexa Fluor-conjugated phalloidin (1:50; red).
Figure 3
Figure 3
Basal and activation statuses of phospho-Smad2, Smad4, E-cadherin, and N-cadherin in HuCCT-1 cells treated with TGF-β. HuCCT-1 cells were stimulated with rTGF-β1 (5 ng ml−1), and the cells were extracted after 1, 3, 6, 12, 24, 48 or 72 h. The levels of phosphorylated and total proteins were detected by western blotting analysis. C indicates control samples. (A) Time-dependent changes in the expression levels of phospho-Smad2, Smad4, and β-actin in response to rTGF-β1 stimulation. Densitometric analyses of the data are shown under the western blotting bands. *P<0.05 vs control cells. (B) Time-dependent changes in the expression levels of E-, N-cadherin, and β-actin in response to rTGF-β1 stimulation. Data represent the means±s.e.m. of triplicate analyses.
Figure 4
Figure 4
Immunohistochemical staining of E-cadherin and N-cadherin in primary EHCC samples. (A) High E-cadherin expression in a primary EHCC. (B) Reduced E-cadherin expression in a primary EHCC. (C) High N-cadherin expression in a primary EHCC. (D) Low N-cadherin expression in a primary EHCC.
Figure 5
Figure 5
Relationships between postoperative survival and E-cadherin and N-cadherin expression. (A) The cancer-specific survival rates at 5 years after surgery were 53.4% for the high E-cadherin expression group and 0% for the low E-cadherin expression group. Kaplan–Meier curves are shown (P=0.0059, Log-rank test). (B) The cancer-specific survival rates at 5 years after surgery were 0% for the N-cadherin-positive group and 36.3% for the N-cadherin-negative group. Kaplan–Meier curves are shown (P=0.8025, Log-rank test). (C) Number of patients in the following four subgroups: E-cadherin high expression/N-cadherin-positive; E-cadherin high expression/N-cadherin-negative; E-cadherin low expression/N-cadherin-positive; and E-cadherin low expression/N-cadherin-negative. (D) Kaplan–Meier curves of the E-cadherin high expression/N-cadherin-negative and E-cadherin low expression/N-cadherin-positive subgroups are shown (P=0.017, Log-rank test). The cancer-specific survival rates at 5 years after surgery were 50.9% for the E-cadherin high expression/N-cadherin-negative group and 0% for the E-cadherin low expression/N-cadherin-positive group.

References

    1. Birchmeier C, Birchmeier W, Brand-Saberi B (1996) Epithelial-mesenchymal transitions in cancer progression. Acta Anat (Basel) 156: 217–226 - PubMed
    1. Chamberlain RS, Blumgart LH (2000) Hilar cholangiocarcinoma: a review and commentary. Ann Surg Oncol 7: 55–66 - PubMed
    1. Christiansen JJ, Rajasekaran AK (2006) Reassessing epithelial to mesenchymal transition as a prerequisite for carcinoma invasion and metastasis. Cancer Res 66: 8319–8326 - PubMed
    1. Derycke LD, Bracke ME (2004) N-cadherin in the spotlight of cell-cell adhesion, differentiation, embryogenesis, invasion and signalling. Int J Dev Biol 48: 463–476 - PubMed
    1. Derynck R, Akhurst RJ, Balmain A (2001) TGF-beta signaling in tumor suppression and cancer progression. Nat Genet 29: 117–129 - PubMed