. 2011 Nov 15;108(46):18708-13.
doi: 10.1073/pnas.1111840108. Epub 2011 Nov 8.

Redefining the relevance of established cancer cell lines to the study of mechanisms of clinical anti-cancer drug resistance

Affiliations

Redefining the relevance of established cancer cell lines to the study of mechanisms of clinical anti-cancer drug resistance

Jean-Pierre Gillet et al. Proc Natl Acad Sci U S A. .

Abstract

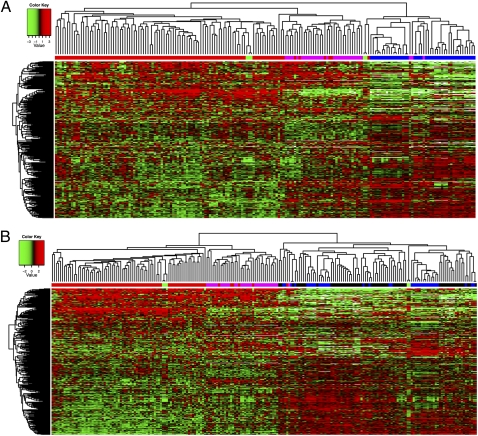
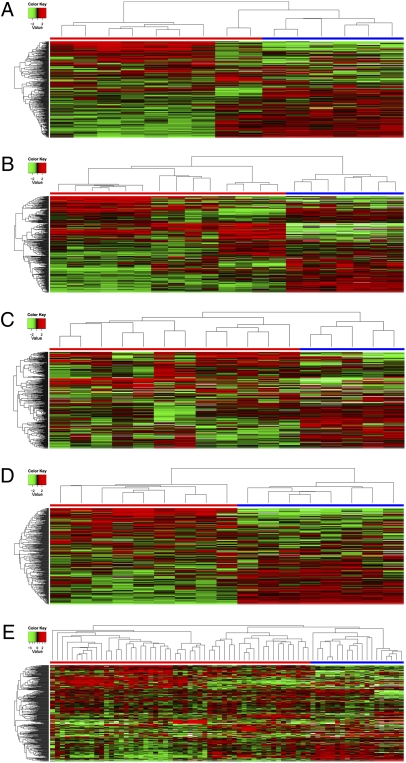
Although in vitro models have been a cornerstone of anti-cancer drug development, their direct applicability to clinical cancer research has been uncertain. Using a state-of-the-art Taqman-based quantitative RT-PCR assay, we investigated the multidrug resistance (MDR) transcriptome of six cancer types, in established cancer cell lines (grown in monolayer, 3D scaffold, or in xenograft) and clinical samples, either containing >75% tumor cells or microdissected. The MDR transcriptome was determined a priori based on an extensive curation of the literature published during the last three decades, which led to the enumeration of 380 genes. No correlation was found between clinical samples and established cancer cell lines. As expected, we found up-regulation of genes that would facilitate survival across all cultured cancer cell lines evaluated. More troubling, however, were data showing that all of the cell lines, grown either in vitro or in vivo, bear more resemblance to each other, regardless of the tissue of origin, than to the clinical samples they are supposed to model. Although cultured cells can be used to study many aspects of cancer biology and response of cells to drugs, this study emphasizes the necessity for new in vitro cancer models and the use of primary tumor models in which gene expression can be manipulated and small molecules tested in a setting that more closely mimics the in vivo cancer microenvironment so as to avoid radical changes in gene expression profiles brought on by extended periods of cell culture.


Conflict of interest statement

The authors declare no conflict of interest.

Figures

Fig. 1.
Fig. 1.
Hierarchical clustering using the average linkage algorithm and 1-Pearson correlation as the distance measure of the ovarian cancer samples analyzed. (A) The 380 MDR-linked gene expression profile (measured by using TLDA) of ovarian cancer models (in vitro and in vivo) is strikingly different from that of specimens of untreated ovarian primary serous carcinoma taken from 80 patients and 32 effusion samples originating from primary ovarian serous carcinoma. The x axis shows clusters of samples. Red, primary ovarian serous carcinoma; magenta, effusion samples originating from primary ovarian serous carcinoma; green, normal ovarian tissue; blue, in vitro models of ovarian cancer, including xenograft models of ovarian cancer, ovarian cancer cell lines of the NCI-60 panel, and cisplatin-resistant cell lines. The y axis shows gene clustering. (B) When adding the eight additional cancer types of the NCI-60 panel to the heatmap presented in A, the striking observation is made that all of the cell lines either grown in vitro or in vivo bear more resemblance to each other, regardless of the tissue of origin, than to the clinical samples that they are supposed to model. Along the x axis: red, primary ovarian serous carcinoma; magenta, effusion samples originating from primary ovarian serous carcinoma; green, normal ovarian tissue; blue, in vitro models of ovarian cancer; black, cancer cell lines of the eight additional cancer types of the NCI-60 panel. The y axis shows gene clustering.
Fig. 2.
Fig. 2.
Hierarchical clustering (using the average linkage algorithm and 1-Pearson correlation as the distance measure) reveals two distinct clusters that discriminate between the in vitro models (cancer cell lines of the NCI-60 panel) and the clinical samples. (A) Heatmap of nine clinical samples of glioblastoma cancer, including four primary tumors, three recurrent tumors, and two metastases. (B) Heatmap of seven colon cancer samples paired with normal colon tissue taken during tumor resection. (C) Heatmap of seven clinical samples of breast cancer, four normal breast tissues, and five cancer cell lines. (D) Heatmap of nine metastatic melanoma samples. (E) Heatmap generated from 23 T-acute lymphoblastic leukemia (12 were untreated, whereas 11 received conventional chemotherapy) and 11 paired samples of acute myeloid leukemia taken at diagnosis and after relapse. x axis: blue, cell lines; red, tumors. The y axis shows gene clustering. Labels for x-axis samples analyzed can be seen in Fig. S7 AE.

References

    1. Rhodes DR, et al. Molecular concepts analysis links tumors, pathways, mechanisms, and drugs. Neoplasia. 2007;9:443–454. - PMC - PubMed
    1. Simon R. Lost in translation: Problems and pitfalls in translating laboratory observations to clinical utility. Eur J Cancer. 2008;44:2707–2713. - PMC - PubMed
    1. Gillet JP, Gottesman MM. Advances in the molecular detection of ABC transporters involved in multidrug resistance in cancer. Curr Pharm Biotechnol. 2011;12:686–692. - PMC - PubMed
    1. Borrell B. How accurate are cancer cell lines? Nature. 2010;463:858. - PubMed
    1. Neve RM, et al. A collection of breast cancer cell lines for the study of functionally distinct cancer subtypes. Cancer Cell. 2006;10:515–527. - PMC - PubMed

Publication types

MeSH terms

Substances

Associated data