Review
. 2012 Jan 1;4(1):a011353.
doi: 10.1101/cshperspect.a011353.

Calcium control of neurotransmitter release

Affiliations
Review

Calcium control of neurotransmitter release

Thomas C Südhof. Cold Spring Harb Perspect Biol. .

Abstract

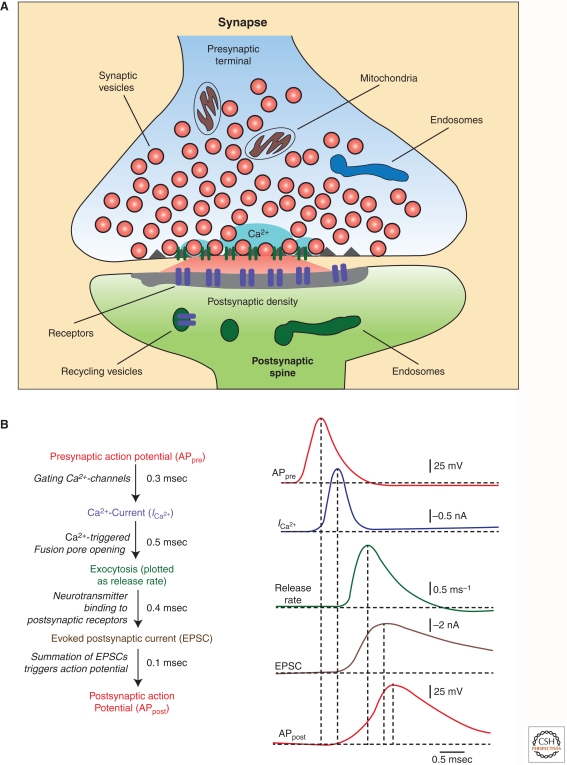
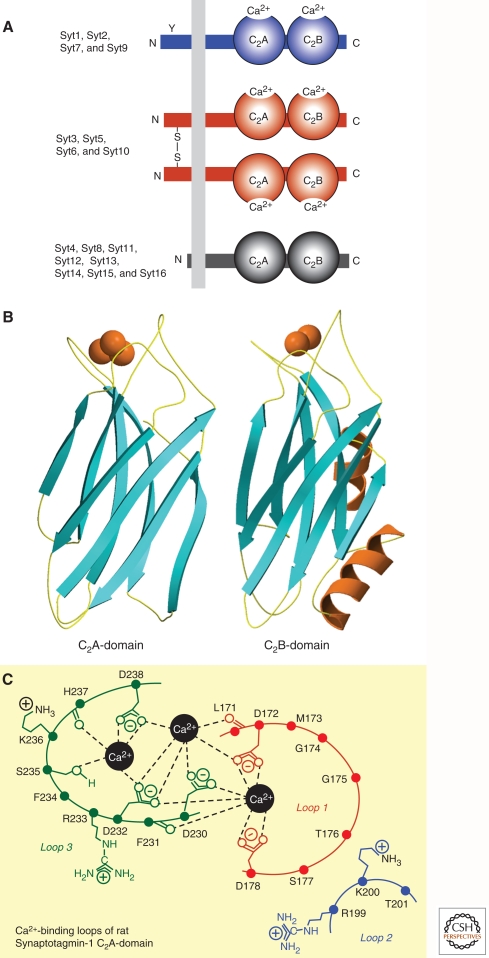
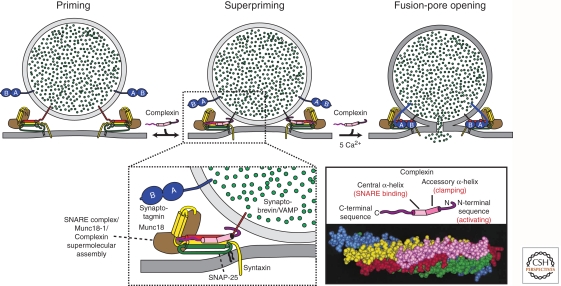
Upon entering a presynaptic terminal, an action potential opens Ca(2+) channels, and transiently increases the local Ca(2+) concentration at the presynaptic active zone. Ca(2+) then triggers neurotransmitter release within a few hundred microseconds by activating synaptotagmins Ca(2+). Synaptotagmins bind Ca(2+) via two C2-domains, and transduce the Ca(2+) signal into a nanomechanical activation of the membrane fusion machinery; this activation is mediated by the Ca(2+)-dependent interaction of the synaptotagmin C2-domains with phospholipids and SNARE proteins. In triggering exocytosis, synaptotagmins do not act alone, but require an obligatory cofactor called complexin, a small protein that binds to SNARE complexes and simultaneously activates and clamps the SNARE complexes, thereby positioning the SNARE complexes for subsequent synaptotagmin action. The conserved function of synaptotagmins and complexins operates generally in most, if not all, Ca(2+)-regulated forms of exocytosis throughout the body in addition to synaptic vesicle exocytosis, including in the degranulation of mast cells, acrosome exocytosis in sperm cells, hormone secretion from endocrine cells, and neuropeptide release.


Figures

Figure 1.
Figure 1.
Principle and time course of Ca2+-triggered synaptic transmission. (A) Schematic diagram of a synapse illustrating the localized influx of Ca2+ at the active zone (red = secreted neurotransmitters). (B) Schematic illustration of the sequence and time course of synaptic transmission as measured by simultaneous pre- and postsynaptic patch-clamp recordings at the calyx of Held synapse. Note that Ca2+ currents and EPSC are shown inverted. (Images are modified from Südhof 2004 and Meinrenken et al. 2003.)
Figure 2.
Figure 2.
Structures and Ca2+-binding properties of synaptotagmins. (A) Canonical domain structuresand classification of synaptotagmins. Mammals express 16 synaptotagmins composed of an amino-terminal transmembrane region preceded by a short noncytoplasmic sequence and followed by a variable linker sequence and two C2-domains; in addition, a 17th related protein called B/K-protein contains the same domain structure but an amino-terminal lipid anchor instead of the transmembrane region (see Pang and Südhof 2010, for a discussion of additional synaptotagmin-related proteins). Eight synaptotagmins bind Ca2+ (Syt1, 2, 3, 5, 6, 7, 9, and 10; blue and red); the remaining synaptotagmins do not (black). The eight Ca2+-binding synaptotagmins fall into two broad classes that differ in the absence (Syt1, 2, 7, and 9; blue) or presence (Syt3, 5, 6, and 10; red) of disulfide-bonded cysteine residues in their amino-terminal sequences. Note that Syt1 and 2 include an N-glycosylated sequence at the amino terminus (indicated by a “Y”), and that Syt7 is extensively alternatively spliced in the linker sequence (Han et al. 2004). (B) Atomic structures of the C2A- and C2B-domains of Syt1 containing bound Ca2+ ions (red spheres) bound to flexible loops formed by an eight-stranded β-sandwich (from Sutton et al. 1995; Ubach et al. 1998; Fernandez et al. 2001). (C) Structure of the Ca2+-binding sites of the Syt1 C2A-domain (modified from Fernández-Chacón et al. 2001). The Syt1 C2A-domain contains three Ca2+-binding sites, of which the central two are canonical for all Ca2+-binding C2-domains, whereas the third Ca2+ site on the left is variably observed in C2-domains, and is absent from the Syt1 C2B-domain. A further Ca2+-binding site that localizes to loop1 on the right is observed in some C2-domains, but is absent from Syt1 and is not shown. Loops refer to the flexible sequences on the top of the Syt1 C2-domain sandwich; the structures of some of the side chains are indicated.
Figure 3.
Figure 3.
Syt1, Syt2, and Syt9 function as synaptic Ca2+ sensors for neurotransmitter release. (A) Deletion of Syt1 in cortical neurons blocks fast synchronous neurotransmitter release. Panels depict representative inhibitory postsynaptic currents (IPSCs) monitored in cortical neurons cultured from littermate wild-type (WT) and Syt1 knockout (Syt1 KO) neurons (arrow = action potential). These data and those shown in panels B–D were modified from Xu et al. (2007). (B) Screen of all Ca2+-binding synaptotagmin isoforms for their ability to rescue the loss of fast neurotransmitter release in Syt1 KO neurons. Data shown are means IPSC amplitudes (± s.e.m.); note that only Syt1, 2, and 9 are capable of rescue. (C) Syt1, Syt2, and Syt9 mediate Ca2+ triggering of release with distinct kinetics. Data shown are representative IPSCs monitored in Syt1 KO neurons expressing Syt1, 2, or 9. IPSCs were normalized for the maximal amplitude. The traces on the right display an expanded part of the overall IPSCs depicted on the left. (D) Quantitation of the kinetics of the increase in the IPSC (left, as mean rise time) and the decay of the IPSC (right, as mean time constant of the IPSC decay) triggered by Ca2+ binding to Syt1, 2, or 9. Note that IPSCs mediated by Syt2 exhibit the fastest rise and decay kinetics, whereas IPSCs mediated by Syt9 are twofold slower. All error bars indicate s.e.m.; asterisks indicate statistically significant differences as assessed by Student’s t-test (*p < 0.05; **p < 0.01; ***p < 0.001).
Figure 4.
Figure 4.
Syt1 Ca2+-binding site point mutations illustrate Syt1 function as a Ca2+ sensor for evoked and spontaneous neurotransmitter release. (A) Evoked IPSCs measured in neurons cultured from knockin mice carrying single amino-acid substitutions in the Ca2+-binding site of the Syt1 C2A-domain. Three knockin mice, each with an individual littermate control (gray) were analyzed: mice with the D232N substitution that increases the amount of Ca2+-stimulated SNARE-complex binding by Syt1 (green; Pang et al. 2006); the R233Q substitution that greatly decreases the apparent Ca2+ affinity of Syt1 during phospholipid binding (blue; Fernández-Chacón et al. 2001); and the D238N substitution that modestly decreases the apparent Ca2+ affinity of Syt1 (red; Pang et al. 2006). Action-potential evoked IPSCs were measured at the indicated concentrations of extracellular Ca2+; the plot on the left depicts the absolute IPSC amplitude as a function of the extracellular Ca2+ concentration, whereas the summary graphs on the right display the parameters for the apparent Ca2+ affinity and Ca2+ cooperativity of release obtained by fitting individual Ca2+ titration experiments to a Hill function. (B) Same as (A), except that the frequency of spontaneous release events was measured. For both (A) and (B), data are means ± s.e.m. (Figure is adapted from Xu et al. 2007.)
Figure 5.
Figure 5.
Schematic diagram of the mechanism of action of synaptotagmin and its complexin cofactor in Ca2+-triggered exocytosis. The top diagram displays the sequential priming of synaptic vesicles by partial SNARE/SM protein complex assembly, superpriming by binding of complexin to partially assembled SNARE complexes, and Ca2+ triggering of fusion-pore opening by Ca2+ binding to synaptotagmin. The objects in the diagram approximate real-size relationships. The diagram on the bottom left depicts a cartoon of a partially assembled SNARE/SM protein complex with complexin bound. The functional domain structure of complexin is shown on the right, with a space-filling model of complexin bound to a SNARE complex at the bottom (pink, the two 〈-helices of complexin; yellow, syntaxin-1; red, synaptobrevin; green and blue, SNAP-25). (The model and the functional assignment of complexin sequences are modified from Maximov et al. 2009; the complexin/SNARE complex crystal structure is modified from Chen et al. 2002.)
Figure 6.
Figure 6.
Illustration of distinct but similar functions of different synaptotagmins: Syt10 acts as a Ca2+ sensor for IGF-1 containing vesicles in mitral neurons from olfactory bulb. (A) IGF-1 secretion from cultured olfactory bulb neurons is stimulated by depolarization with 15 mm KCl, but impaired by deletion of Syt10 (this and the following panels were modified from Cao et al. 2011). (B) Syt10 colocalizes with IGF-1 containing vesicles in the somatodendritic regions of cultured mitral neurons. Images show double immunofluorescence labeling of tagged Syt10 and either IGF-1, synapsin, or MAP2 as indicated. (C) Illustration of the distinct functions of Syt1 and Syt10 as Ca2+ sensors exclusively for synaptic and IGF-1-containing vesicles, respectively, in mitral neurons.

References

    1. Andrews NW, Chakrabarti S 2005. There’s more to life than neurotransmission: The regulation of exocytosis by synaptotagmin VII. Trends Cell Biol 15: 626–631 - PubMed
    1. Augustine GJ, Charlton MP, Smith SJ 1985. Calcium entry and transmitter release at voltage-clamped nerve terminals of squid. J Physiol 367: 163–181 - PMC - PubMed
    1. Barber CF, Jorquera RA, Melom JE, Littleton JT 2009. Postsynaptic regulation of synaptic plasticity by synaptotagmin 4 requires both C2 domains. J Cell Biol 187: 295–310 - PMC - PubMed
    1. Bennett MK, Calakos N, Scheller RH 1992. Syntaxin: A synaptic protein implicated in docking of synaptic vesicles at presynaptic active zones. Science 257: 255–259 - PubMed
    1. Brose N, Petrenko AG, Südhof TC, Jahn R 1992. Synaptotagmin: A Ca2+ sensor on the synaptic vesicle surface. Science 256: 1021–1025 - PubMed

Publication types

LinkOut - more resources