. 2012 Feb;40(2):145-60.
doi: 10.3758/s13421-011-0158-0.

On the interpretation of removable interactions: a survey of the field 33 years after Loftus

Affiliations

On the interpretation of removable interactions: a survey of the field 33 years after Loftus

Eric-Jan Wagenmakers et al. Mem Cognit. 2012 Feb.

Abstract

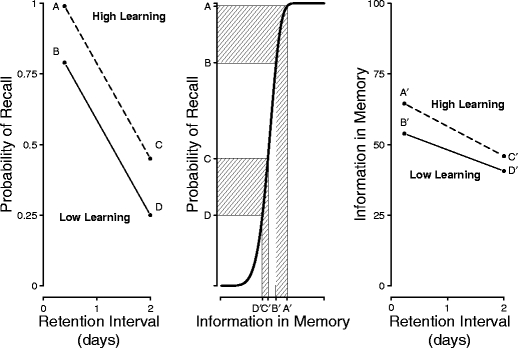
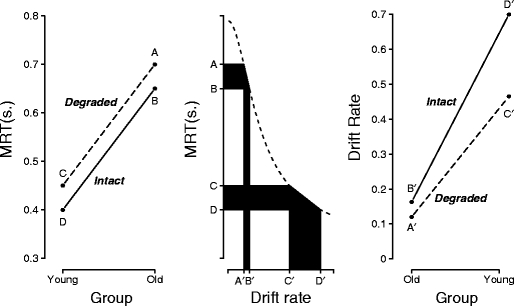
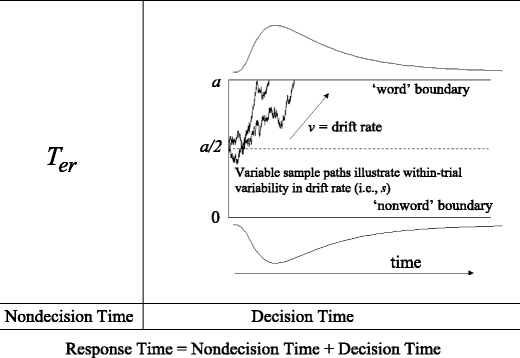
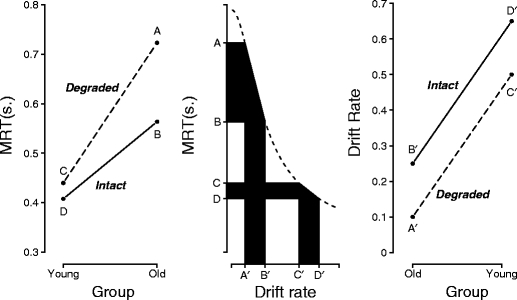
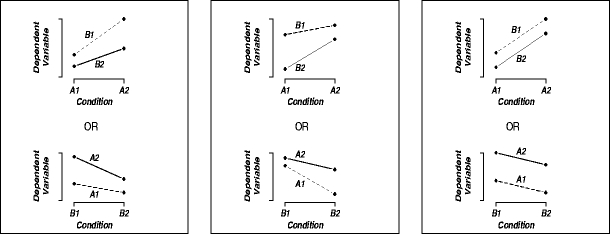
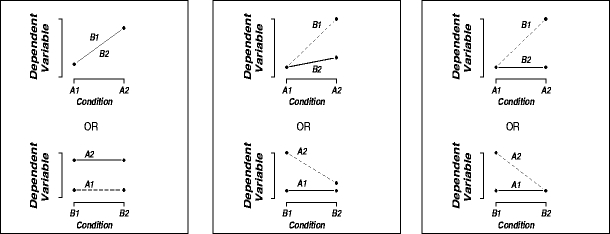
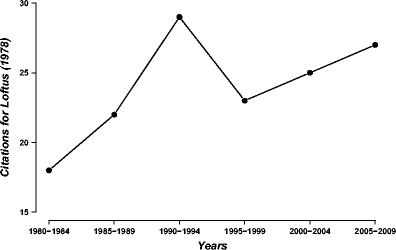
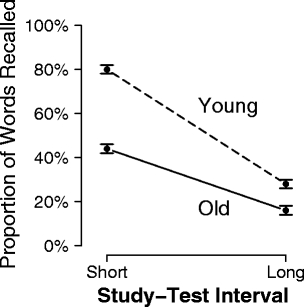
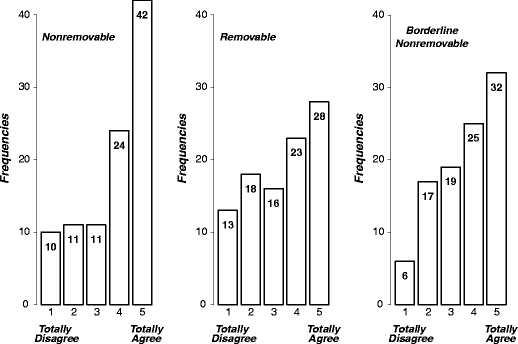
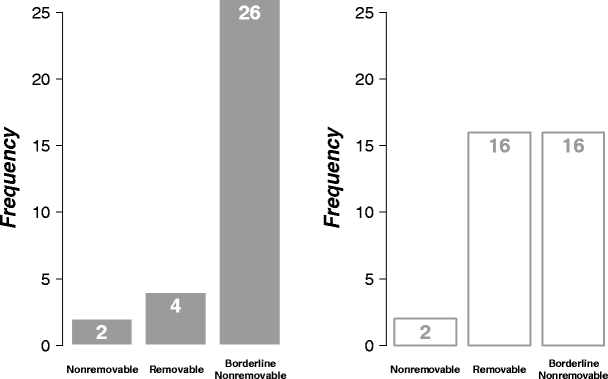
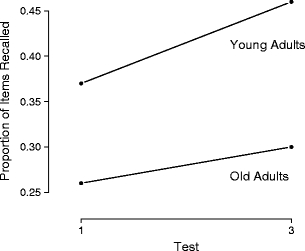
In a classic 1978 Memory & Cognition article, Geoff Loftus explained why noncrossover interactions are removable. These removable interactions are tied to the scale of measurement for the dependent variable and therefore do not allow unambiguous conclusions about latent psychological processes. In the present article, we present concrete examples of how this insight helps prevent experimental psychologists from drawing incorrect conclusions about the effects of forgetting and aging. In addition, we extend the Loftus classification scheme for interactions to include those on the cusp between removable and nonremovable. Finally, we use various methods (i.e., a study of citation histories, a questionnaire for psychology students and faculty members, an analysis of statistical textbooks, and a review of articles published in the 2008 issue of Psychology and Aging) to show that experimental psychologists have remained generally unaware of the concept of removable interactions. We conclude that there is more to interactions in a 2 × 2 design than meets the eye.


Figures

Fig. 1
Fig. 1
Additive effects on the probability of recall correspond to interaction effects on information in memory. The left panel shows data from a hypothetical 2 × 2 experiment with high initial learning and low initial learning in which probability of recall was assessed after a few hours and after 2 days. The effect is additive, since high and low learning are associated with exactly the same delay-driven decrease in recall probability. The middle panel shows how probability of recall could map on to information stored in memory (arbitrary units). We do not know this function, but for convenience we used the Weibull CDF, such that Pr(recall) = 1 − exp(−(information/50)6); that is, probability of recall increases with information stored in memory in a sigmoid fashion. The right panel shows that retention interval interacts with the initial level of learning
Fig. 2
Fig. 2
Interaction effects on the probability of recall correspond to additive effects on information in memory. The left panel shows data from a hypothetical 2 × 2 experiment with high initial learning and low initial learning in which probability of recall was assessed after a few hours and after 2 days. The effect is interactive, since the high and low learning are associated with a very different delay-driven decrease in recall probability. The middle panel shows how probability of recall could map on to information stored in memory (arbitrary units) according to Pr(recall) = 1 − exp(−(information/50)6). The right panel shows that retention interval does not interact with the initial level of learning
Fig. 3
Fig. 3
Additive effects on MRT correspond to interaction effects on drift rate. The left panel shows an additive effect on MRT in a hypothetical 2 × 2 experiment with young and old participants who are confronted with intact and degraded stimuli. The middle panel shows how mean RT maps onto drift rate, a diffusion model parameter that we assume is uniquely responsible for the observed differences in performance. The right panel shows the corresponding interaction effect on drift rate
Fig. 4
Fig. 4
The EZ-diffusion model as applied to a lexical decision task. Noisy information is accumulated from a starting point equidistant between two response boundaries. A response is initiated as soon as the accumulation process reaches a boundary. Total response time is an additive combination of decision time and nondecision time, Ter. See text for details
Fig. 5
Fig. 5
Interaction effects on MRT may correspond to additive effects on drift rate. The left panel shows an interaction effect on MRT in a hypothetical 2 × 2 experiment with young and old participants who are confronted with intact and degraded stimuli. The middle panel shows how mean RT maps onto drift rate, a diffusion model parameter that we assume is uniquely responsible for the observed differences in performance. The right panel shows the corresponding additive effect on drift rate. When comparing the left and right panels, note that short MRTs correspond to high drift rates and vice versa
Fig. 6
Fig. 6
Removable interactions. These interactions can be transformed to additivity (or vice versa) by a monotonic change of the measurement scale. Note: A1 and A2 refer to two levels of factor A; B1 and B2 refer to two levels of factor B. Within each column, the top graph plots factor A on the x-axis, and the corresponding bottom graph plots factor B on the x-axis
Fig. 7
Fig. 7
Nonremovable interactions. These interactions cannot be transformed to additivity by a monotonic change of the measurement scale. Note: A1 and A2 refer to two levels of factor A; B1 and B2 refer to two levels of factor B. Within each column, the top graph plots factor A on the x-axis, and the corresponding bottom graph plots factor B on the x-axis
Fig. 8
Fig. 8
Borderline nonremovable interactions. These interactions are on the cusp between removable and nonremovable. Theoretically, these interactions are nonremovable, but in practice their classification hinges on the statistical evidence in favor of a point-null hypothesis. Note that the top-left panel features two lines that overlap. Note: A1 and A2 refer to two levels of factor A; B1 and B2 refer to two levels of factor B. Within each column, the top graph plots factor A on the x-axis, and the corresponding bottom graph plots factor B on the x-axis
Fig. 9
Fig. 9
Number of peer-reviewed articles that cite Loftus (1978) in 5-year intervals
Fig. 10
Fig. 10
Example item from a questionnaire that tests knowledge of removable interactions. After reading a cover story, participants were confronted with this figure and had to indicate their level of agreement with the statement “An increase in study–test interval affects long-term memory of young adults more than it affects that of older adults”
Fig. 11
Fig. 11
Students and faculty members in psychology generally agree with the statement that synthetic data show an interaction, even when this statement is formulated in terms of a latent psychological process. Note: Out of 100 participants, two did not answer the question about the nonremovable interaction, and one did not answer the question about the borderline nonremovable interaction
Fig. 12
Fig. 12
Frequencies of nonremovable, removable, and borderline nonremovable interactions reported in the 2008 issue of Psychology and Aging. The left panel contains the interactions for which post hoc tests allowed a definite classification. The right panel contains the interactions for which post hoc tests were not reported and classification had to be based on visual inspection instead
Fig. 13
Fig. 13
Example of a removable interaction that is interpreted in terms of increases in recall (Henkel, 2008)

Similar articles

Cited by

References

    1. Abelson RP. Statistics as principled argument. Hillsdale: Erbaum; 1995.
    1. Agresti A, Finlay B. Statistical methods for the social sciences. New York: Pearson; 2009.
    1. Anderson NH. Scales and statistics: Parametric and nonparametric. Psychological Bulletin. 1961;58:305–316. doi: 10.1037/h0042576. - DOI - PubMed
    1. Anderson NH. Comparison of different populations: Resistance to extinction and transfer. Psychological Review. 1963;70:162–179. doi: 10.1037/h0044858. - DOI - PubMed
    1. Aron A, Aron E, Coups E. Statistics for psychology. 4. New York: Pearson; 2006.

Personal name as subject

LinkOut - more resources