. 2012 Feb 3;287(6):3617-29.
doi: 10.1074/jbc.M111.277178. Epub 2011 Nov 8.

Functional selective oxytocin-derived agonists discriminate between individual G protein family subtypes

Affiliations

Functional selective oxytocin-derived agonists discriminate between individual G protein family subtypes

Marta Busnelli et al. J Biol Chem. .

Abstract

We used a bioluminescence resonance energy transfer biosensor to screen for functional selective ligands of the human oxytocin (OT) receptor. We demonstrated that OT promoted the direct engagement and activation of G(q) and all the G(i/o) subtypes at the OT receptor. Other peptidic analogues, chosen because of specific substitutions in key OT structural/functional residues, all showed biased activation of G protein subtypes. No ligand, except OT, activated G(oA) or G(oB), and, with only one exception, all of the peptides that activated G(q) also activated G(i2) and G(i3) but not G(i1), G(oA), or G(oB), indicating a strong bias toward these subunits. Two peptides (DNalOVT and atosiban) activated only G(i1) or G(i3), failed to recruit β-arrestins, and did not induce receptor internalization, providing the first clear examples of ligands differentiating individual G(i/o) family members. Both analogs inhibited cell proliferation, showing that a single G(i) subtype-mediated pathway is sufficient to prompt this physiological response. These analogs represent unique tools for examining the contribution of G(i/o) members in complex biological responses and open the way to the development of drugs with peculiar selectivity profiles. This is of particular relevance because OT has been shown to improve symptoms in neurodevelopmental and psychiatric disorders characterized by abnormal social behaviors, such as autism. Functional selective ligands, activating a specific G protein signaling pathway, may possess a higher efficacy and specificity on OT-based therapeutics.


Figures

FIGURE 1.
FIGURE 1.
BRET measurements of OTR-Gαβ1γ2 coupling and activation following OT stimulation. a, BRET2 was measured between Rluc (the donor) and GFP10 (the acceptor), respectively, introduced at the C-terminal tail of OTR (OTR-Rluc) and the N-terminal domain of the Gγ2 subunit (GFP10-Gγ2). OT-induced OTR-Gα coupling places OTR-Rluc and GFP10-Gγ2 near each other, which corresponds to an increase in the GFP10/Rluc BRET ratio. BRET was measured in HEK293 cells co-expressing OTR-RLuc, GFP10-Gγ2, and Gβ1 in the absence (−α, empty bar) or presence of the indicated Gα subunits (n = 4). The results are the differences in the BRET signal with OT (10 μm) or PBS (mean value ± S.D. of three independent experiments). One-way ANOVA followed by Dunnett's test was used to determine the statistical differences between OT-promoted BRET in the presence of the indicated Gα proteins and non-Gα-transfected controls (***, p < 0.001). b, a BRET titration curve was performed in HEK 293 cells transiently transfected to co-express Gαs-113-Rluc8 and OTR- GFP2 or CD4- GFP10 in combination with β1γ2 subunits. The amount of plasmid encoding GFP2-tagged proteins varied (from 0.031 to 8 μg), whereas the amount of Gαs-113-Rluc8 was kept constant (3 μg). Data are representative of two experiments and were fit using linear regression. c, Gαs activation was evaluated with BRET in HEK293 cells co-expressing OTR or the positive control V2R with GFP10-Gγ2, Gβ1, and Gαs-Rluc8 tagged subunits. Cells were stimulated with OT or AVP at the concentration indicated. The results are the differences in the BRET signal with OT, AVP, or PBS (empty bar) (mean values ± S.D. (error bars) of three independent experiments). One-way ANOVA followed by Dunnett's test was used to determine the statistical differences between ligand-promoted BRET in the presence of the indicated ligand and untreated controls (***, p < 0.001). d, BRET2 was measured between Rluc (the donor) and GFP10 (the acceptor), introduced into the α helical domain of the indicated Gα subunits and the N-terminal domain of Gγ2 (GFP10-Gγ2), respectively. Ligand-induced OTR-Gα activation leads to a conformational rearrangement of the heterotrimeric G protein complex that corresponds to a decrease in the BRET ratio. BRET was measured in HEK293 cells co-expressing OTR, GFP10-Gγ2, Gβ1, and Rluc/Rluc8-tagged Gα subunits: αq (n = 6), αi1 (n = 14), αi2 (n = 5), αi3 (n = 8), αoA (n = 3), and αoB (n = 3). The results are the differences in the BRET signal with OT (10 μm) or PBS and are expressed as mean values ± S.D. One-way ANOVA followed by Dunnett's test was used to determine the statistical differences between OT-promoted BRET in the presence of the indicated Gα proteins and untreated controls (base line) (***, p < 0.001).
FIGURE 2.
FIGURE 2.
BRET measurements of the OT dose-response activation of OTR-Gαβ1γ2 complexes in HEK293 cells. BRET was measured in HEK293 cells co-expressing the indicated Gα Rluc/Rluc8 proteins (Gαq-97-Rluc (a), Gαi1-91-Rluc (b), Gαi2-91-Rluc (c), Gαi3-91-Rluc (d), GαoB-91-Rluc8 (e), and GαoA-91-Rluc8 (f)), together with OTR, GFP10-Gγ2, and Gβ1. The GFP10/Rluc ratios were similar for all pairs: 0.66 for Gαq-97-Rluc, 0.89 for Gαi1-91-Rluc, 0.65 for Gαi2-91-Rluc, 0.68 for Gα3-91-Rluc, 0.59 for GαoB-91-Rluc8, and 0.61 for GαoA-91-Rluc8. The cells were stimulated with increasing concentrations of OT (from 10−11 to 10−4 m) for 2 min. The results are the differences in the BRET signal in the presence and absence of OT and are expressed as the mean value ± S.D. (error bars) of at least three independent determinations. Calculated EC50 values were 2.16 ± 0. 95, 62.63 ± 39.00, 32.27 ± 11.05, 11.50 ± 7.22, 29.80 ± 19.32, and 91.80 ± 26.00 nm, respectively.
FIGURE 3.
FIGURE 3.
Inositol phosphate production in OTR-expressing HEK293 cells following OT and OT-derived peptide stimulation. IP1 production was measured using an immunocompetitive HTRF-based assay (HTRF IPOne, Cisbio) in HEK293 cells stably expressing the N-terminally myc-tagged OTR (HEK mycOTR). A total of 100,000 cells were stimulated for 30 min with the OT and OT-derived peptides at a final concentration of 10 μm. The data are expressed as the mean value ± S.D. (error bars). of three independent experiments, each performed in sextuplicate. One-way ANOVA followed by Dunnett's test was used to determine the statistical differences in IP1 production in the presence of the indicated ligand and untreated controls (PBS) (*, p < 0.05; **, p < 0.01; ***, p < 0.001).
FIGURE 4.
FIGURE 4.
BRET measurements of OT and OT-derived ligand activation of OTR-Gαβ1γ2 complexes in HEK293 cells. BRET was measured in HEK293 cells co-expressing OTR, GFP10-Gγ2, Gβ1, and the indicated GαRluc constructs: Gαq-Rluc (a), Gαi1-Rluc (b), Gαi2-Rluc (c), Gαi3-Rluc (d), GαoA-Rluc8 (e), and GαoB-Rluc8 (f). The cells were stimulated for 2 min with OT and OT-derived peptides at a final concentration of 10 μm; at this dose, OT produced a peak BRET ratio signal in all of the tested Gα proteins. The results are the differences in the BRET signals in the presence and absence of ligands (10 μm) and are expressed as the mean value ± S.D. (error bars) of at least six independent determinations. The statistical significance of the differences between stimulated and unstimulated (PBS) cells was assessed using one-way ANOVA followed by Dunnett's test (*, p < 0.05; ***, p < 0.001).
FIGURE 5.
FIGURE 5.
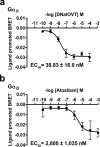
BRET measurements of DNalOVT and atosiban dose-response activation of OTR-Gαβ1γ2 complexes in HEK293 cells. The BRET ratio was recorded in HEK293 cells transfected with cDNAs encoding for OTR, GFP10-Gγ2, Gβ1, and Gαi1-91-Rluc or Gαi3-91-Rluc for EC50 determination. The cells were stimulated with increasing concentrations of DNalOVT (a) and atosiban (b) (from 10−10 to 10−3 m). The data are expressed as the mean value ± S.D. (error bars) of at least three independent determinations.
FIGURE 6.
FIGURE 6.
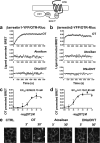
BRET measurements of OTR-mediated β-arrestin1 and β-arrestin2 recruitment in HEK293 cells following OT, atosiban, and DNalOVT stimulation. BRET1 was monitored between Rluc and YFP introduced at the C-terminal of OTR (OTR-RLuc) and the β-arrestins: β-arrestin1-YFP (a) and β-arrestin2-YFP (b). HEK293 cells co-expressing OTR-Rluc and β-arrestins-YFP were stimulated by OT (10 μm), DNalOVT (10 μm), and atosiban (1 mm). Real-time BRET1 measurements were made every 20 s. The results are the differences in the BRET signals in the presence and absence of agonist and are expressed as the mean value ± S.D. (error bars) of 3–5 independent experiments. c and d, BRET concentration-response curves of OT-induced β-arrestin recruitment in HEK293 cells. HEK293 cells co-expressing OTR-Rluc and β-arrestin1-YFP (c) or β-arrestin2-YFP (d) were treated with OT (10−10 to 10−4 m). The BRET signal was recorded at maximum plateau level (2 min for β-arrestin2 and 5 min for β-arrestin1). The results are the differences in the BRET signals in the presence and absence of agonist and are expressed as the mean value ± S.D. of three independent experiments. e, imaging of OTR-GFP internalization upon ligand stimulation. The subcellular localization of recombinant OTR C-terminally fused to EGFP (OTR-EGFP) was visualized by means of laser scanning confocal microscopy in stably transfected HEK293 OTR-EGFP cells. The cells were fixed before (CTRL) and after incubation with OT (100 nm), DNalOVT (100 nm), and atosiban (10 μm) for 3 and 30 min at 37 °C. Scale bar, 10 μm.
FIGURE 7.
FIGURE 7.
Atosiban and DNalOVT inhibit cell growth via a PTX-sensitive pathway. Atosiban and DNalOVT effects on cell growth were analyzed in HEK293 cells stably expressing the OTR fused to EGFP (OTR-EGFP) (a) and DU145 human prostate cancer cells endogenously expressing OTR (b). The cells were treated with OT, DNalOVT, and atosiban at a final concentration of 100 nm in the presence or absence of PTX (150 ng/ml). Cell growth was determined by means of an [3-(4,5-dimethylthiazol-2-yl)-5-(3-carboxymethoxyphenyl)-2-(4-sulfophenyl)-2H-tetrazolium] (MTS)-based assay after 48 h (HEK293 cells) or 72 h (DU145 cells) of peptide treatment. The results are the percentage variations in the number of cells under treated versus untreated conditions (ctrl); the differences were statistically analyzed using one-way ANOVA followed by Dunnett's test (**, p < 0.01; ***, p < 0.001). Error bars, S.D.

References

    1. Urban J. D., Clarke W. P., von Zastrow M., Nichols D. E., Kobilka B., Weinstein H., Javitch J. A., Roth B. L., Christopoulos A., Sexton P. M., Miller K. J., Spedding M., Mailman R. B. (2007) Functional selectivity and classical concepts of quantitative pharmacology. J. Pharmacol. Exp. Ther. 320, 1–13 - PubMed
    1. Zhou X. B., Lutz S., Steffens F., Korth M., Wieland T. (2007) Oxytocin receptors differentially signal via Gq and Gi proteins in pregnant and nonpregnant rat uterine myocytes: implications for myometrial contractility. Mol. Endocrinol. 21, 740–752 - PubMed
    1. Strakova Z., Soloff M. S. (1997) Coupling of oxytocin receptor to G proteins in rat myometrium during labor: Gi receptor interaction. Am. J. Physiol. 272, E870–E876 - PubMed
    1. Gravati M., Busnelli M., Bulgheroni E., Reversi A., Spaiardi P., Parenti M., Toselli M., Chini B. (2010) Dual modulation of inward rectifier potassium currents in olfactory neuronal cells by promiscuous G protein coupling of the oxytocin receptor. J. Neurochem. 114, 1424–1435 - PubMed
    1. Rimoldi V., Reversi A., Taverna E., Rosa P., Francolini M., Cassoni P., Parenti M., Chini B. (2003) Oxytocin receptor elicits different EGFR/MAPK activation patterns depending on its localization in caveolin-1 enriched domains. Oncogene 22, 6054–6060 - PubMed

Publication types

MeSH terms