Review
. 2012 Jan 2;287(1):35-42.
doi: 10.1074/jbc.R111.283408. Epub 2011 Nov 8.

Inference of functional properties from large-scale analysis of enzyme superfamilies

Affiliations
Review

Inference of functional properties from large-scale analysis of enzyme superfamilies

Shoshana D Brown et al. J Biol Chem. .

Abstract

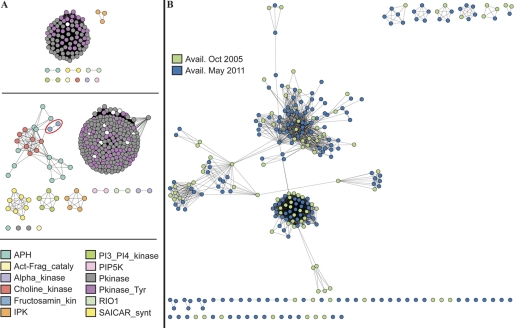
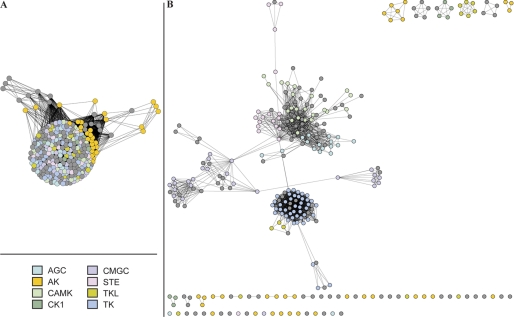
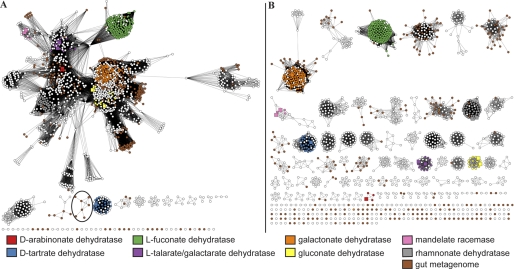
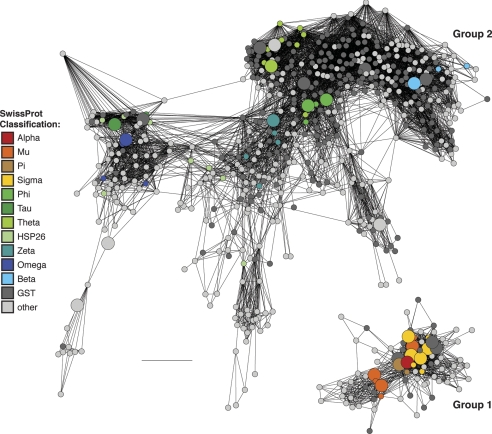
As increasingly large amounts of data from genome and other sequencing projects become available, new approaches are needed to determine the functions of the proteins these genes encode. We show how large-scale computational analysis can help to address this challenge by linking functional information to sequence and structural similarities using protein similarity networks. Network analyses using three functionally diverse enzyme superfamilies illustrate the use of these approaches for facile updating and comparison of available structures for a large superfamily, for creation of functional hypotheses for metagenomic sequences, and to summarize the limits of our functional knowledge about even well studied superfamilies.


Figures

FIGURE 1.
FIGURE 1.
Structure similarity networks of ePK-like superfamily generated from pairwise comparisons using FAST algorithm. Each node represents a structure. Each edge represents a connection with a FAST N-score better than a given threshold. A, FAST N-score cutoff = 11, colored by Pfam family. Upper panel, structures available as of October 2005 (97 nodes). At this cutoff, the average root mean square deviation (r.m.s.d.) is ∼2.81 Å with ∼213 Cα atoms aligned. Lower panel, structures available as of May 2011 (295 nodes). At this cutoff, the average r.m.s.d. is ∼2.98 Å with ∼207 Cα atoms aligned. B, FAST N-score cutoff = 23. At this cutoff, the average r.m.s.d. is ∼1.97 with ∼247 Cα atoms aligned. Nodes colored green represent structures available in the Protein Data Bank as of October 2005; those colored blue represent structures added to the Protein Data Bank between October 2005 and May 2011 (total of 295 nodes). Nodes were arranged using the yFiles organic layout provided with Cytoscape version 2.7. Lengths of edges are not meaningful except that sequences in tightly clustered groups are relatively more similar to each other than sequences with few connections.
FIGURE 2.
FIGURE 2.
Alternative view of structure similarity networks of 86 representative structures in ePK-like superfamily (generated as described for Fig. 1). Nodes are colored according to their Manning/Bourne group classification. Dark gray nodes represent structures that were not classified. A, FAST N-score cutoff = 4. B, FAST N-score cutoff = 23.
FIGURE 3.
FIGURE 3.
Sequence similarity networks of acid-sugar dehydratases known or predicted to belong to enolase superfamily and human gut microbiome. Networks were generated from all-by-all BLAST comparisons of 1578 sequences representing sequences of eight known acid-sugar dehydratase families and the mandelate racemase family from the mandelate racemase subgroup (see Footnote 5) as defined by SFLD and a filtered set of gut metagenome sequences that showed significant similarity to the members of the subgroup. Each of the 1578 nodes represents a sequence. Larger square nodes represent those that have been experimentally characterized, so their reaction and substrate specificities are known. Brown nodes represent sequences from the human gut metagenome, and white nodes represent SFLD sequences in the subgroup for which the reaction and substrate specificities have not been predicted. The remainder (small nodes) represent sequences for which specificity can be predicted at high confidence, colored by their SFLD family names (see Footnote 4). Nodes were arranged using the yFiles organic layout provided with Cytoscape version 2.7. A, each edge in the network represents a BLAST connection with an e-value of 1e−44 or better. At this cutoff, sequences have a median percent identity and alignment length of ∼32% and 369, respectively. B, each edge in the network represents a BLAST connection with an e-value of 1e−84 or better. At this cutoff, sequences have a median percent identity and alignment length of ∼44% and 384, respectively. Lengths of edges are not meaningful except that sequences in tightly clustered groups are relatively more similar to each other than sequences with few connections.
FIGURE 4.
FIGURE 4.
Sequence similarity network of cytosolic GSTs. Similarity is defined by pairwise BLAST alignments better than an e-value cutoff of 1e−12. 622 representative sequences that are a maximum of 40% identical and that span the diversity of >6000 GSTs are shown. Nodes are colored by classification of the sequence in the Swiss-Prot Database (part of the UniProt Database), if available. The 40 large nodes designate sequences with structures. At this cutoff, edges at this threshold represent alignments with a median 27% identity over 200 residues. This network and legend are adapted from Ref. with permission.

References

    1. UniProt Consortium (2011) Nucleic Acids Res. 39, D214–D219 - PMC - PubMed
    1. Dutta S., Burkhardt K., Young J., Swaminathan G. J., Matsuura T., Henrick K., Nakamura H., Berman H. M. (2009) Mol. Biotechnol 42, 1–13 - PubMed
    1. Qin J., Li R., Raes J., Arumugam M., Burgdorf K. S., Manichanh C., Nielsen T., Pons N., Levenez F., Yamada T., Mende D. R., Li J., Xu J., Li S., Li D., Cao J., Wang B., Liang H., Zheng H., Xie Y., Tap J., Lepage P., Bertalan M., Batto J. M., Hansen T., Le Paslier D., Linneberg A., Nielsen H. B., Pelletier E., Renault P., Sicheritz-Ponten T., Turner K., Zhu H., Yu C., Li S., Jian M., Zhou Y., Li Y., Zhang X., Li S., Qin N., Yang H., Wang J., Brunak S., Doré J., Guarner F., Kristiansen K., Pedersen O., Parkhill J., Weissenbach J., Bork P., Ehrlich S. D., Wang J. (2010) Nature 464, 59–65 - PMC - PubMed
    1. Roberts R. J., Chang Y. C., Hu Z., Rachlin J. N., Anton B. P., Pokrzywa R. M., Choi H. P., Faller L. L., Guleria J., Housman G., Klitgord N., Mazumdar V., McGettrick M. G., Osmani L., Swaminathan R., Tao K. R., Letovsky S., Vitkup D., Segrè D., Salzberg S. L., Delisi C., Steffen M., Kasif S. (2011) Nucleic Acids Res. 39, D11–D14 - PMC - PubMed
    1. Bateman A. (2010) Bioinformatics 26, 991. - PubMed

Publication types