. 2012 Jan 2;287(1):322-336.
doi: 10.1074/jbc.M111.272195. Epub 2011 Nov 8.

Direct interaction between scaffolding proteins RACK1 and 14-3-3ζ regulates brain-derived neurotrophic factor (BDNF) transcription

Affiliations

Direct interaction between scaffolding proteins RACK1 and 14-3-3ζ regulates brain-derived neurotrophic factor (BDNF) transcription

Jérémie Neasta et al. J Biol Chem. .

Abstract

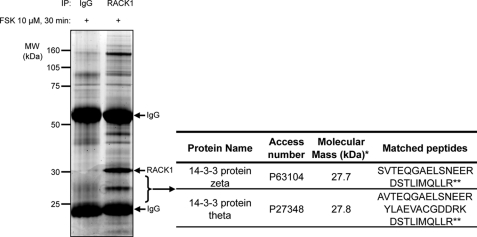
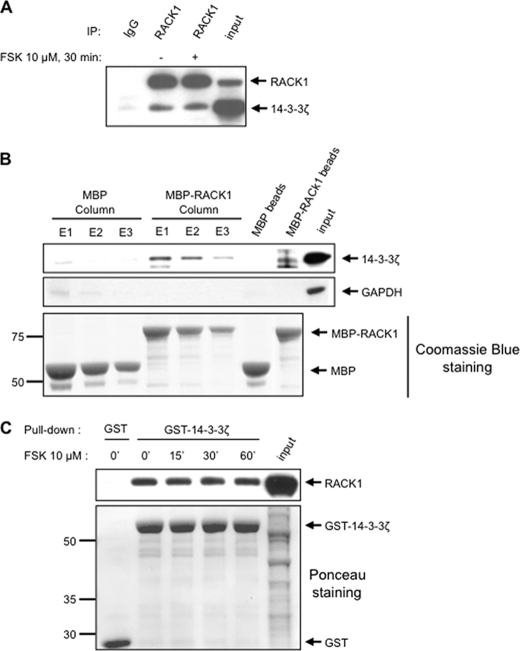
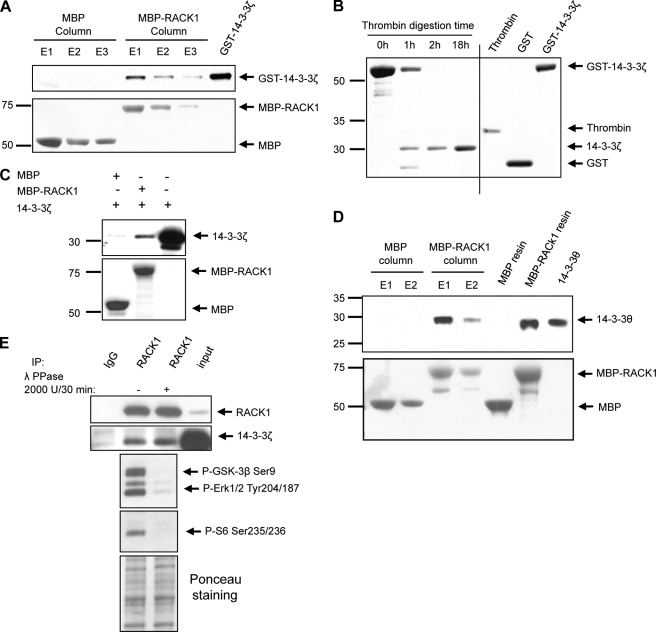
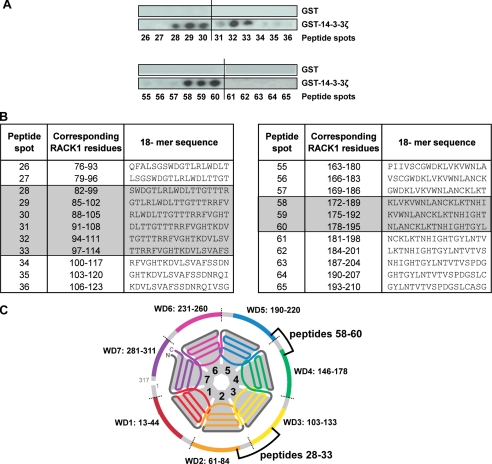
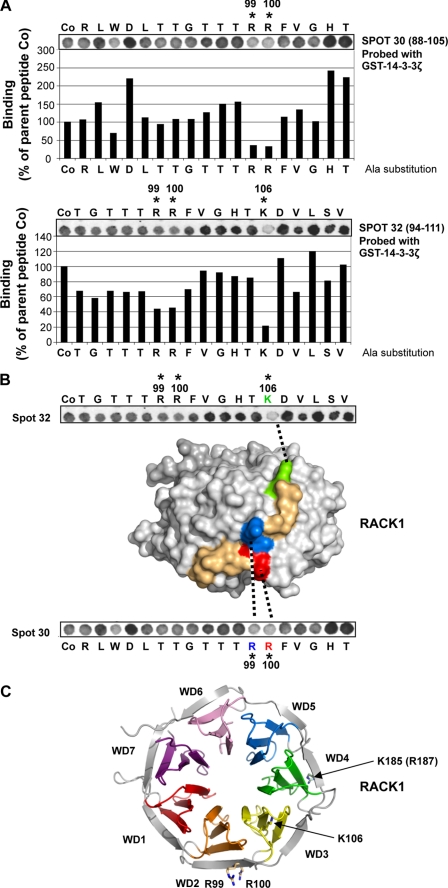
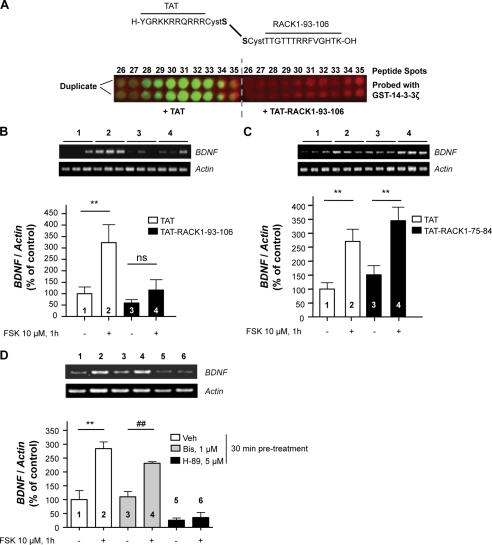
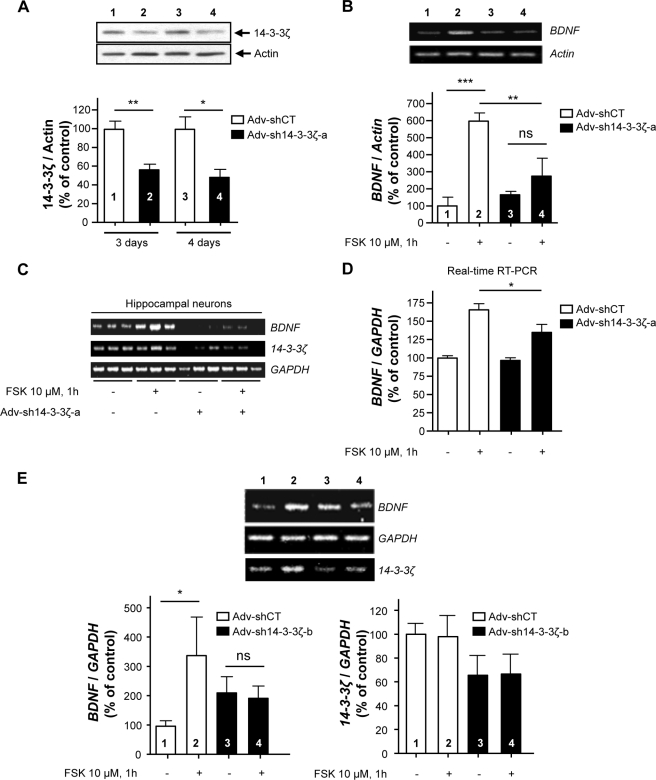
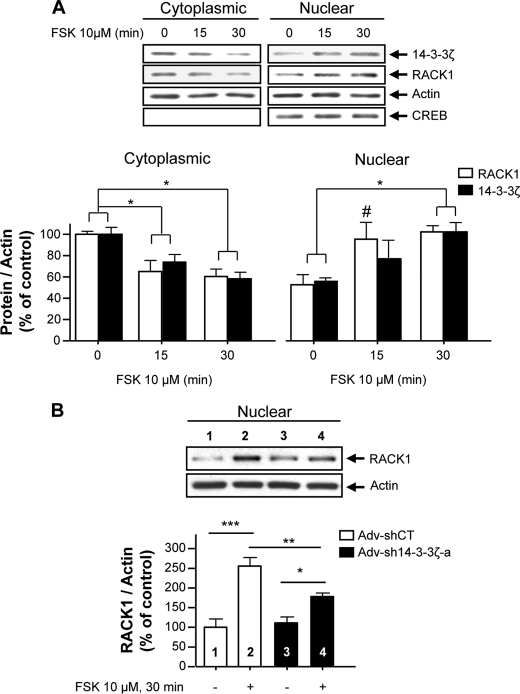
RACK1 is a scaffolding protein that spatially and temporally regulates numerous signaling cascades. We previously found that activation of the cAMP signaling pathway induces the translocation of RACK1 to the nucleus. We further showed that nuclear RACK1 is required to promote the transcription of the brain-derived neurotrophic factor (BDNF). Here, we set out to elucidate the mechanism underlying cAMP-dependent RACK1 nuclear translocation and BDNF transcription. We identified the scaffolding protein 14-3-3ζ as a direct binding partner of RACK1. Moreover, we found that 14-3-3ζ was necessary for the cAMP-dependent translocation of RACK1 to the nucleus. We further observed that the disruption of RACK1/14-3-3ζ interaction with a peptide derived from the RACK1/14-3-3ζ binding site or shRNA-mediated 14-3-3ζ knockdown inhibited cAMP induction of BDNF transcription. Together, these data reveal that the function of nuclear RACK1 is mediated through its interaction with 14-3-3ζ. As RACK1 and 14-3-3ζ are two multifunctional scaffolding proteins that coordinate a wide variety of signaling events, their interaction is likely to regulate other essential cellular functions.


Figures

FIGURE 1.
FIGURE 1.
Mass spectrometry identification of 14-3-3ζ and 14-3-3θ as binding partners of RACK1. SHSY5Y cells were treated with 10 μm FSK for 30 min and then lysed in IP buffer. RACK1 was immunoprecipitated from cell lysate, and proteins were resolved by SDS-PAGE. The gel was stained with Deep Purple to visualize proteins. Gel slices were in-gel protein-digested, and the resulting peptides were submitted to mass spectrometry (MS/MS) sequencing for protein identification. 14-3-3ζ and 14-3-3θ were identified in the RACK1 immunoprecipitate but not in the corresponding gel section representing the IgG control. Identification of 14-3-3ζ and 14-3-3θ proteins is based on matching two and three peptides, respectively. Among these peptides, one is common to both isoforms. Evidence of MS-based protein identification is provided in the supplemental material. n = 2. *, reflects DNA sequence-based amino acid composition; **, common peptide for both proteins. Access, accession.
FIGURE 2.
FIGURE 2.
Validation of 14-3-3ζ as binding partner of RACK1. A, SHSY5Y cells were treated with vehicle or 10 μm FSK for 30 min and then lysed in IP buffer. RACK1 was immunoprecipitated from whole cell lysate, and proteins were resolved by SDS-PAGE. Endogenous RACK1 and 14-3-3ζ were revealed by Western blot. n = 3. B, recombinant MBP and MBP-RACK1 were immobilized on an amylose resin column and incubated with SHSY5Y lysate previously treated with 10 μm FSK for 30 min. After extensive washing, bound proteins were eluted three times with 50 mm maltose (E1, E2, and E3) or with loading buffer (MBP beads and MBP-RACK1 beads). Proteins were resolved by SDS-PAGE and detected by Western blot. The amount of MBP and MBP-RACK1 eluted was controlled with colloidal Coomassie Blue staining. n = 2. C, recombinant GST and GST-14-3-3ζ immobilized on glutathione-Sepharose were incubated with SHSY5Y lysate previously treated with vehicle or 10 μm FSK for the indicated duration. After extensive washing, pulled down proteins were resolved by SDS-PAGE and transferred to a nitrocellulose membrane. The membrane was first stained with Ponceau S (lower panel) and then immunoblotted with RACK1 antibody (upper panel). n = 3. ′, minutes.
FIGURE 3.
FIGURE 3.
14-3-3ζ and 14-3-3θ directly bind to RACK1 in phosphoindependent manner. A, recombinant MBP and MBP-RACK1 were immobilized on an amylose resin column and incubated with purified recombinant GST-14-3-3ζ. After extensive washing, maltose-eluted proteins (E1, E2, and E3) were resolved by SDS-PAGE, transferred to a nitrocellulose membrane, and stained with Ponceau S (lower panel). The presence of GST-14-3-3ζ was subsequently determined by Western blot using anti-14-3-3ζ antibody (upper panel). n = 3. B, GST-14-3-3ζ was subjected to thrombin digestion for 1, 2, and 18 h. Digests were resolved by SDS-PAGE, and proteins were stained with colloidal Coomassie Blue. C, MBP or MBP-RACK1 immobilized on amylose resin was incubated with recombinant thrombin-digested 14-3-3ζ. After extensive washing, proteins were eluted in loading buffer, resolved by SDS-PAGE, transferred to a nitrocellulose membrane, and stained with Ponceau S (lower panel). The presence of 14-3-3ζ was subsequently determined by Western blot (upper panel). n = 2. D, recombinant MBP and MBP-RACK1 were immobilized on an amylose resin column and incubated with recombinant thrombin-digested 14-3-3θ. After extensive washing, proteins were eluted with loading buffer (MBP resin and MBP-RACK1 resin lanes) or with maltose (E1 and E2). Proteins were resolved by SDS-PAGE, transferred to a nitrocellulose membrane, and stained with Ponceau S (lower panel). The presence of 14-3-3θ was subsequently determined by Western blot using an anti-pan14-3-3 antibody (upper panel). n = 2. E, SHSY5Y cells were lysed in IP buffer supplemented with MnCl2. Cell lysate was treated with λ-phosphatase (λ PPase) before the immunoprecipitation assay with anti-RACK1 antibody. The presence of 14-3-3ζ in the RACK1 immunoprecipitate was subsequently determined by Western blot. In parallel, the efficiency of protein dephosphorylation was controlled in the same samples by Western blot analyses using several anti-phosphospecific antibodies. Ponceau S staining was used to control for sample loading in SDS-PAGE. n = 4.
FIGURE 4.
FIGURE 4.
Peptide array analysis of RACK1 for identification of potential 14-3-3ζ binding loci. A, an array of immobilized 18-mer peptide spots frame-shifted in three-residue increments and spanning the entire length of RACK1 was probed with GST-14-3-3ζ. Binding of 14-3-3ζ was detected (dark spots) using anti-GST antibody (presented here for peptides 26–36 and 55–65). n = 2. B, tabulated sequences for peptides spots 26–36 and 55–65 corresponding to the amino acid sequence of RACK1. RACK1-derived peptides interacting with 14-3-3ζ are shaded. C, the schematic of RACK1 structure defines the position of the WD repeats and highlights the relative locations of candidate loci for 14-3-3ζ binding; peptide numbers relate to the tabulated sequences detailed in B.
FIGURE 5.
FIGURE 5.
Alanine-scanning array analysis of RACK1 peptides 30 and 32. A, arrays in which the 18 amino acids in RACK1-derived 18-mer peptides 30 and 32 (defined in Fig. 4B) were sequentially substituted with alanine were probed using GST-14-3-3ζ. The binding of GST-14-3-3ζ to each alanine-substituted RACK1 peptide was detected by anti-GST antibody and quantified by densitometry and is presented here as a percentage relative to the binding of GST-14-3-3ζ to the unsubstituted parent peptides (Co). n = 2. B, a surface rendition of the homologous A. thaliana RACK1A structure (9) with the cognate sequence (93AAGVSTRRFVGHTK106) shown colored reveals that the residues have prominent exposure on the edge of propeller blade WD2 and connecting loop to blade WD3. C, structure of RACK1A protein from A. thaliana (9) showing prominently surface-exposed side chains of basic residues Arg99, Arg100, and Lys106 (indicated by *) and cognate residue Lys185 (Arg187 in RACK1A) from the 14-3-3ζ binding locus on RACK1.
FIGURE 6.
FIGURE 6.
TAT-RACK1-(93–106) peptide blocks cAMP-mediated induction of BDNF transcription. A, RACK1-derived 18-mer peptides 26–35 were incubated with GST-14-3-3ζ in the presence of 100 μm TAT or TAT-RACK1-(93–106) peptide for 2 h at room temperature. Binding of 14-3-3ζ was detected (green spots) by anti-GST antibody and Alexa Fluor 800-coupled secondary antibody using a green channel of an Odyssey infrared image scanner. Peptide autofluorescence in the red channel was used to control the presence of immobilized 18-mer peptide spots 26–35 on both arrays. n = 2. B and C, SHSY5Y cells were incubated with 10 μm TAT, TAT-RACK1-(93–106) (B), or TAT-RACK1-(75–84) (C) peptide for 30 min prior to treatment with 10 μm FSK for 1 h. The levels of BDNF and actin mRNAs were analyzed by RT-PCR. The histogram depicts the mean ratio of BDNF to actin expressed as the percentage of control ±S.E. In B, n = 8–9. Two-way ANOVA showed a main effect of treatment (F(1,31) = 8.41, p = 0.007) and peptide (F(1,31) = 6.62, p = 0.015) but no interaction (F(1,31) = 2.99, p = 0.094). Subsequent analysis using the method of contrasts (one-tailed unpaired t test) detected a significant difference between vehicle and FSK in the TAT peptide group (**, p = 0.008) but not in the TAT-RACK1-(93–106) peptide group (ns, p = 0.114). In C, n = 5–6. Two-way ANOVA showed a main effect of treatment (F(1,19) = 23.68, p < 0.001) but no effect of the peptide (F(1,19) = 2.81, p = 0.11) or interaction (F(1,19) = 0.01, p = 0.756). Subsequent analysis using the method of contrasts (one-tailed unpaired t test) detected a significant difference between vehicle (Veh) and FSK in both TAT peptide group (**, p = 0.003) and TAT-RACK1-(75–84) peptide group (**, p = 0.004). D, SHSY5Y cells were incubated with 1 μm bisindolylmaleimide I hydrochloride (Bis) or 5 μm H-89 for 30 min before treatment with 10 μm FSK for 1 h. The levels of BDNF and actin mRNA were analyzed by RT-PCR. The histogram depicts the mean ratio of BDNF to actin expressed as the percentage of control ±S.E. n = 3; **, p = 0.005; ##, p = 0.002 (one-tailed unpaired t test). Numbers refer to the treatment indicated in the image and histogram.
FIGURE 7.
FIGURE 7.
Down-regulation of 14-3-3ζ expression inhibits cAMP-induced BDNF transcription. A, control (Adv-shCT) and Adv-sh14-3-3ζ-a recombinant adenoviruses were used to infect SHSY5Y cells for 3 and 4 days. The 14-3-3ζ protein level was analyzed by Western blot. The histogram depicts the mean ratio of 14-3-3ζ to actin expressed as the percentage of control ±S.E. n = 3; **, p = 0.007; *, p = 0.016 (one-tailed unpaired t test). B, SHSY5Y cells were infected with recombinant Adv-shCT or Adv-sh14-3-3ζ-a for 3 days and treated with 10 μm FSK for 1 h. The levels of BDNF and actin mRNAs were analyzed by RT-PCR. The histogram depicts the mean ratio of BDNF to actin expressed as the percentage of control ±S.E. n = 3. Two-way ANOVA showed an interaction between the treatment and the virus (F(1,8) = 9.16, p = 0.016). ***, p < 0.001; **, p = 0.007; ns, p = 0.26 (Newman-Keuls post hoc analysis). C and D, down-regulation of 14-3-3ζ inhibits cAMP/PKA-mediated induction of BDNF transcription in hippocampal neurons. After 14 days in culture, rat hippocampal neurons were infected with recombinant Adv-shCT or Adv-sh14-3-3ζ-a. Seven days later, neurons were treated with vehicle or 10 μm FSK (1 h). C, the levels of BDNF, 14-3-3ζ, and GAPDH mRNAs were analyzed by RT-PCR. n = 3. D, the levels of BDNF and GAPDH mRNAs were analyzed by TaqMan RT-PCR. The histogram depicts the mean ratio of BDNF to GAPDH expressed as the percentage of control ±S.E. n = 5–6. Two-way ANOVA showed an effect of both treatment (F(1,19) = 51.12, p < 0.001) and virus (F(1,19) = 5.51, p = 0.03) but no interaction (F(1,19) = 3.57, p = 0.074). Subsequent analysis using the method of contrasts (one-tailed unpaired t test) detected a significant difference between Adv-shCT and Adv-sh14-3-3ζ within the FSK-treated group (*, p = 0.030). E, SHSY5Y cells were infected with recombinant Adv-shCT or Adv-sh14-3-3ζ-b for 3 days and treated with 10 μm FSK for 1 h. The levels of BDNF, 14-3-3ζ, and GAPDH mRNAs were analyzed by RT-PCR. The histograms depict the mean ratio of BDNF or 14-3-3ζ to GAPDH expressed as the percentage of control ±S.E. n = 5–6. Two-way ANOVA detected no interaction (F(1,19) = 3.67, p = 0.070). Subsequent analysis using the method of contrasts (one-tailed unpaired t test) detected a significant difference between vehicle (−) and FSK (+) within the Adv-shCT group (*, p = 0.038) but not within the Adv-sh14-3-3ζ-b group (ns). A two-way ANOVA was used to analyze 14-3-3ζ knockdown and showed no effect of the treatment (F(1,16) = 0.001, p = 0.975) but did show an effect of the virus (F(1,16) = 4.58, p = 0.048). n = 4–6. Numbers refer to the treatment indicated in the image and histogram.
FIGURE 8.
FIGURE 8.
14-3-3ζ is necessary for cAMP-mediated nuclear translocation of RACK1. A, SHSY5Y cells were treated with 10 μm FSK for 15 and 30 min. Cytoplasmic and nuclear fractions were prepared, and an equal amount of proteins was resolved by SDS-PAGE and transferred to a nitrocellulose membrane. The levels of 14-3-3ζ, RACK1, actin, and CREB in each fraction were analyzed by Western blot analysis. The histogram depicts the mean ratio ±S.E. of 14-3-3ζ or RACK1 to actin and is expressed as the percentage of control. n = 3–4. One-way ANOVA showed significant effects of time for cytoplasmic 14-3-3ζ (F(2,8) = 9.24, p = 0.008), for cytoplasmic RACK1 (F(2,6) = 8.47, p = 0.018), for nuclear 14-3-3ζ (F(2,9) = 4.05, p = 0.055), and for nuclear RACK1 (F(2,8) = 7.44, p = 0.015). *, p < 0.05; #, p < 0.05 (15 versus 0 min) (Newman-Keuls post hoc analysis). B, down-regulation of the 14-3-3ζ gene inhibits cAMP/PKA-mediated RACK1 translocation to the nucleus. SHSY5Y cells were infected with recombinant Adv-sh14-3-3ζ-a or Adv-shCT for 3 days as described in Fig. 7A and treated with 10 μm FSK for 30 min, and the levels of RACK1 and actin in each fraction were analyzed by Western blot analysis. The histogram depicts the mean ratio ±S.E. of RACK1 to actin and is expressed as the percentage of control. n = 4. Two-way ANOVA showed an interaction between the treatment and the virus (F(1,12) = 6.37, p = 0.027). ***, p < 0.001; **, p = 0.009; *, p = 0.019 (Newman-Keuls post hoc analysis). Numbers refer to the treatment indicated in the image and histogram.

Similar articles

Cited by

References

    1. Pawson T., Scott J. D. (1997) Science 278, 2075–2080 - PubMed
    1. Scott J. D., Pawson T. (2009) Science 326, 1220–1224 - PMC - PubMed
    1. Shaw A. S., Filbert E. L. (2009) Nat. Rev. Immunol. 9, 47–56 - PubMed
    1. Kholodenko B. N., Hancock J. F., Kolch W. (2010) Nat. Rev. Mol. Cell Biol. 11, 414–426 - PMC - PubMed
    1. Ron D., Chen C. H., Caldwell J., Jamieson L., Orr E., Mochly-Rosen D. (1994) Proc. Natl. Acad. Sci. U.S.A. 91, 839–843 - PMC - PubMed

Publication types

MeSH terms