. 2011;6(11):e27136.
doi: 10.1371/journal.pone.0027136. Epub 2011 Nov 1.

The temporal order of genetic and pathway alterations in tumorigenesis

Affiliations

The temporal order of genetic and pathway alterations in tumorigenesis

Moritz Gerstung et al. PLoS One. 2011.

Abstract

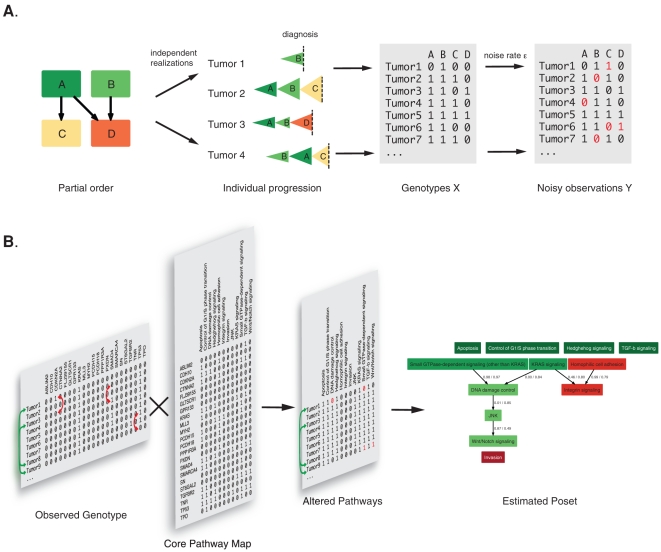
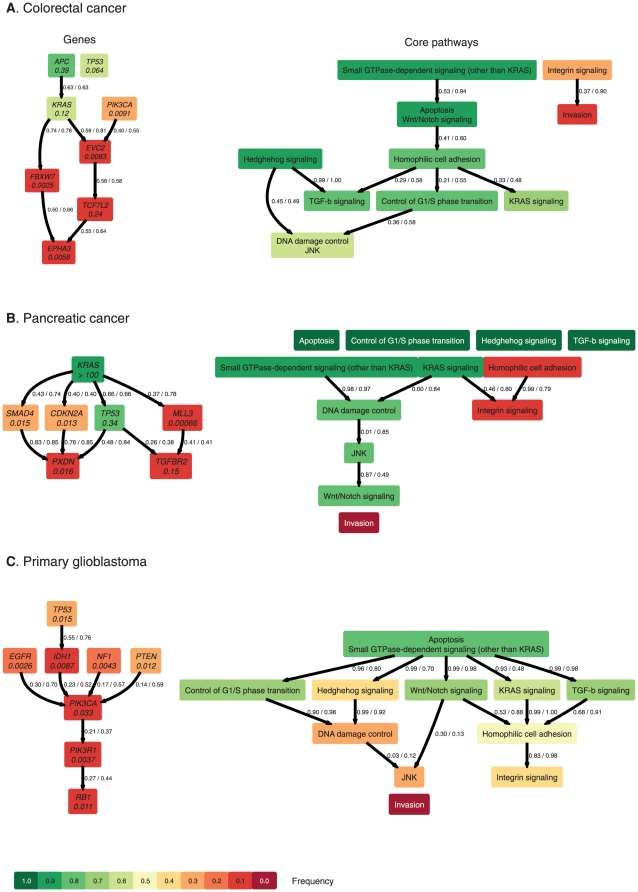
Cancer evolves through the accumulation of mutations, but the order in which mutations occur is poorly understood. Inference of a temporal ordering on the level of genes is challenging because clinically and histologically identical tumors often have few mutated genes in common. This heterogeneity may at least in part be due to mutations in different genes having similar phenotypic effects by acting in the same functional pathway. We estimate the constraints on the order in which alterations accumulate during cancer progression from cross-sectional mutation data using a probabilistic graphical model termed Hidden Conjunctive Bayesian Network (H-CBN). The possible orders are analyzed on the level of genes and, after mapping genes to functional pathways, also on the pathway level. We find stronger evidence for pathway order constraints than for gene order constraints, indicating that temporal ordering results from selective pressure acting at the pathway level. The accumulation of changes in core pathways differs among cancer types, yet a common feature is that progression appears to begin with mutations in genes that regulate apoptosis pathways and to conclude with mutations in genes involved in invasion pathways. H-CBN models provide a quantitative and intuitive model of tumorigenesis showing that the genetic events can be linked to the phenotypic progression on the level of pathways.


Conflict of interest statement

Competing Interests: The authors have declared that no competing interests exist. Dr. Eriksson joined 23andMe after finishing the work on the present manuscript. It is unrelated to his current affiliation and no competing interest exists.

Figures

Figure 1
Figure 1. Schematic illustration of the H-CBN model and gene-to-pathway mapping.
A. Partial order constraints, as denoted by arrows, restrict the possible ordering in which mutations occur. In this example, mutation C arises only after A, and mutation D requires A and B to be present. Mutations A and B can occur in any order. Because the order is only partial, the sequence of events can differ between tumors. The accumulation of each mutation is described by a stochastic exponential waiting time process that corresponds to a clonal expansion. Each tumor thus arises by a series of expansions that differs across tumors depending on the number of constraints. No constraints imply that all orderings are possible; a linear (total) ordering corresponds to a single sequence of events for all cases. Tumors are examined at diagnosis and its genotype X indicates all functionally altered genes that have accumulated until then (1: altered, 0: functional). The observed list of mutated genes Y, however, can contain errors (red) due to incomplete data or wrong interpretation of the results. The most likely constraints and model parameters are estimated from the data Y. B. Mapping of genotypes to core pathways. The list of observed tumor genotypes is transformed to a list of altered core pathways by assuming that a pathway is altered if at least one member of that pathway is mutated. The order of core pathway alterations is then estimated using the H-CBN model. The influence of the gene-to-pathway mapping on the estimated constraints is analyzed by permuting genes among tumors (red arrows). To assess the stability of parameter estimates, bootstrap samples are drawn from the list of genotypes by sampling with replacement (green arrows) and the inference algorithm is run on each.
Figure 2
Figure 2. Most likely order constraints on the gene (left) and core pathway level (right) for colorectal cancer
(A), pancreatic cancer (B), and primary glioblastoma (C). Each edge in the graph denotes an order constraint on the accumulation of alterations. The two values labeling each edge and separated by a slash denote relative frequencies of occurrence of the order constraint in permutation and bootstrap samples, respectively. The estimated yearly accumulation rates are given below the gene name at each node of the graph. The color of a node reflects the frequency of the alteration (dark green 100% to dark red 0%). Nodes labeled with white font have frequencies of exactly 100% or 0% and were not considered for the statistical analysis.
Figure 3
Figure 3. Global pathway progression model for all three cancer types. Each edge denotes an order constraint.
The two numbers at each edge are the frequencies at which the given relation is observed under permutations of the genes and bootstrapping of the data, respectively. Colors denote the relative frequencies at which each pathway is hit by at least one mutation.

References

    1. Merlo LMF, Pepper JW, Reid BJ, Maley CC. Cancer as an evolutionary and ecological process. Nat Rev Cancer. 2006;6:924–935. - PubMed
    1. Michor F, Iwasa Y, Nowak MA. Dynamics of cancer progression. Nat Rev Cancer. 2004;4:197–205. - PubMed
    1. Nowell PC. The clonal evolution of tumor cell populations. Science. 1976;194:23–28. - PubMed
    1. Futreal PA, Coin L, Marshall M, Down T, Hubbard T, et al. A census of human cancer genes. Nat Rev Cancer. 2004;4:177–183. - PMC - PubMed
    1. Hanahan D, Weinberg RA. The hallmarks of cancer. Cell. 2000;100:57–70. - PubMed

Publication types

Substances