

A fluid dynamics study in a 50 cc pulsatile ventricular assist device: influence of heart rate variability
- PMID: 22070327
- PMCID: PMC5413123
- DOI: 10.1115/1.4005001
A fluid dynamics study in a 50 cc pulsatile ventricular assist device: influence of heart rate variability
Abstract
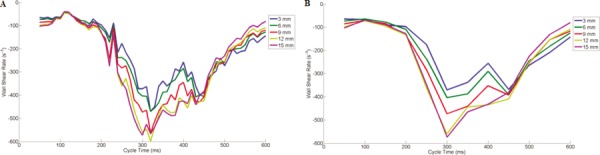
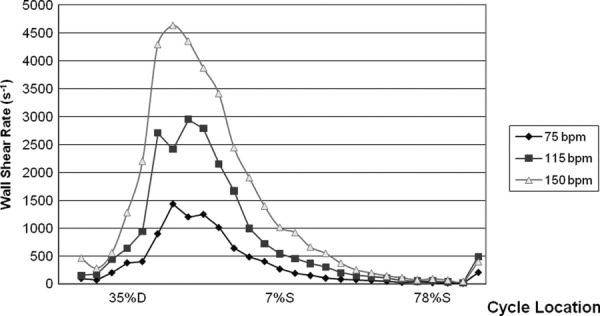
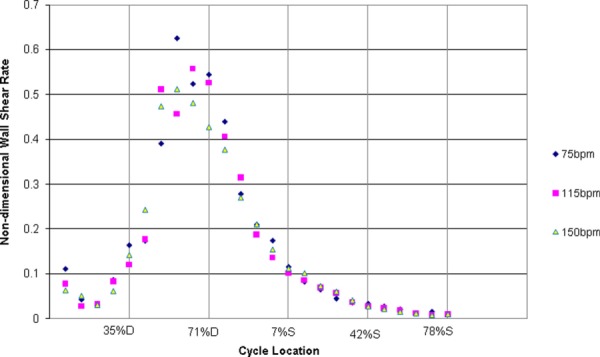
Although left ventricular assist devices (LVADs) have had success in supporting severe heart failure patients, thrombus formation within these devices still limits their long term use. Research has shown that thrombosis in the Penn State pulsatile LVAD, on a polyurethane blood sac, is largely a function of the underlying fluid mechanics and may be correlated to wall shear rates below 500 s(-1). Given the large range of heart rate and systolic durations employed, in vivo it is useful to study the fluid mechanics of pulsatile LVADs under these conditions. Particle image velocimetry (PIV) was used to capture planar flow in the pump body of a Penn State 50 cubic centimeters (cc) LVAD for heart rates of 75-150 bpm and respective systolic durations of 38-50%. Shear rates were calculated along the lower device wall with attention given to the uncertainty of the shear rate measurement as a function of pixel magnification. Spatial and temporal shear rate changes associated with data collection frequency were also investigated. The accuracy of the shear rate calculation improved by approximately 40% as the resolution increased from 35 to 12 μm/pixel. In addition, data collection in 10 ms, rather than 50 ms, intervals was found to be preferable. Increasing heart rate and systolic duration showed little change in wall shear rate patterns, with wall shear rate magnitude scaling by approximately the kinematic viscosity divided by the square of the average inlet velocity, which is essentially half the friction coefficient. Changes in in vivo operating conditions strongly influence wall shear rates within our device, and likely play a significant role in thrombus deposition. Refinement of PIV techniques at higher magnifications can be useful in moving towards better prediction of thrombosis in LVADs.
Figures


Similar articles
-
A thrombus susceptibility comparison of two pulsatile Penn State 50 cc left ventricular assist device designs.Ann Biomed Eng. 2013 Jan;41(1):4-16. doi: 10.1007/s10439-012-0627-z. Epub 2012 Jul 24. Ann Biomed Eng. 2013. PMID: 22825798 Free PMC article.
-
Flow field study comparing design iterations of a 50 cc left ventricular assist device.ASAIO J. 2011 Sep-Oct;57(5):349-57. doi: 10.1097/MAT.0b013e318224e20b. ASAIO J. 2011. PMID: 21734560 Free PMC article.
-
The 12 cc Penn State pulsatile pediatric ventricular assist device: fluid dynamics associated with valve selection.J Biomech Eng. 2008 Aug;130(4):041019. doi: 10.1115/1.2939342. J Biomech Eng. 2008. PMID: 18601461
-
Endothelial Function in Patients With Continuous-Flow Left Ventricular Assist Devices.Angiology. 2021 Jan;72(1):9-15. doi: 10.1177/0003319720946977. Epub 2020 Aug 6. Angiology. 2021. PMID: 32757767 Review.
-
Innovative Modeling Techniques and 3D Printing in Patients with Left Ventricular Assist Devices: A Bridge from Bench to Clinical Practice.J Clin Med. 2019 May 9;8(5):635. doi: 10.3390/jcm8050635. J Clin Med. 2019. PMID: 31075841 Free PMC article. Review.
Cited by
-
Animal blood in translational research: How to adjust animal blood viscosity to the human standard.Physiol Rep. 2021 May;9(10):e14880. doi: 10.14814/phy2.14880. Physiol Rep. 2021. PMID: 34042285 Free PMC article.
-
A thrombus susceptibility comparison of two pulsatile Penn State 50 cc left ventricular assist device designs.Ann Biomed Eng. 2013 Jan;41(1):4-16. doi: 10.1007/s10439-012-0627-z. Epub 2012 Jul 24. Ann Biomed Eng. 2013. PMID: 22825798 Free PMC article.
-
Recent advances in computational methodology for simulation of mechanical circulatory assist devices.Wiley Interdiscip Rev Syst Biol Med. 2014 Mar-Apr;6(2):169-88. doi: 10.1002/wsbm.1260. Epub 2014 Jan 21. Wiley Interdiscip Rev Syst Biol Med. 2014. PMID: 24449607 Free PMC article. Review.
-
The Use of Fluid Mechanics to Predict Regions of Microscopic Thrombus Formation in Pulsatile VADs.Cardiovasc Eng Technol. 2014 Mar 1;5(1):54-69. doi: 10.1007/s13239-014-0174-x. Cardiovasc Eng Technol. 2014. PMID: 24634700 Free PMC article.
References
-
- Lloyd-Jones D., Adams R. J., Brown T. M., Carnethon M., Dai S., De Simone G., Ferguson T. B., Ford E., Furie K., Gillespie C., Go A., Greenlund K., Haase N., Hailpern S., Ho P. M., Howard V., Kissela B., Kittner S., Lack-land D., Lisabeth L., Marelli A., McDermott M. M., Meigs J., Mozaffarian D., Mussolino M., Nichol G., Roger V. L., Rosamond W., Sacco R., Sorlie P., Stafford R., Thom T., Wasserthiel-Smoller S., Wong N. D., and Wylie-Rosett J., 2010, “Executive Summary: Heart Disease and Stroke Statistics – 2010 Update: A Report from the American Heart Association,” Circulation, 121, pp. 948–954.10.1161/CIRCULATIONAHA.109.192666 - DOI - PubMed
-
- Stevenson, L. , Miller, L. , Desvigne-Nickens, P. , Ascheim, D. , Parides, M. , Renlund, D. , Oren, R. , Krueger, S. , Costanzo, M. , Wann, S. , Levitan, R. , and Mancini, D. , 2004, “Left Ventricular Assist Device as Destination for Patients Undergoing Intravenous Inotropic Therapy,” Circulation, 110, pp. 975–981.10.1161/01.CIR.0000139862.48167.23 - DOI - PubMed
-
- Lietz, K. , Long, J. , Kfoury, A. , Slaughter, M. , Silver, M. , Milano, C. , Rogers, J. , Naka, Y. , Mancini, D. , and Miller, L. , 2007, “Outcomes of Left Ventricular Assist Device Implantation as Destination Therapy in the Post-REMATCH Era,” Circulation, 116, pp. 497–505.10.1161/CIRCULATIONAHA.107.691972 - DOI - PubMed
-
- Daneshmand, M. , Rajagopal, K. , Lima, B. , Khorram, N. , Blue, L. , Lodge, A. , Hernzndez, A. , Rogers, J. , and Milano, C. , 2010, “Left Ventricular Assist Device Destination Therapy Versus Extended Criteria Cardiac Transplant,” Ann. Thorac. Surg., 89, pp. 1205–1210.10.1016/j.athoracsur.2009.12.058 - DOI - PubMed
Publication types
MeSH terms
Grants and funding
LinkOut - more resources
Full Text Sources
