. 2011 Dec;138(24):5379-91.
doi: 10.1242/dev.067322. Epub 2011 Nov 9.

The peripheral nervous system supports blood cell homing and survival in the Drosophila larva

Affiliations

The peripheral nervous system supports blood cell homing and survival in the Drosophila larva

Kalpana Makhijani et al. Development. 2011 Dec.

Abstract

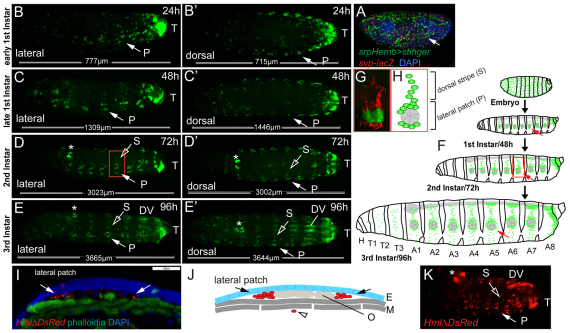
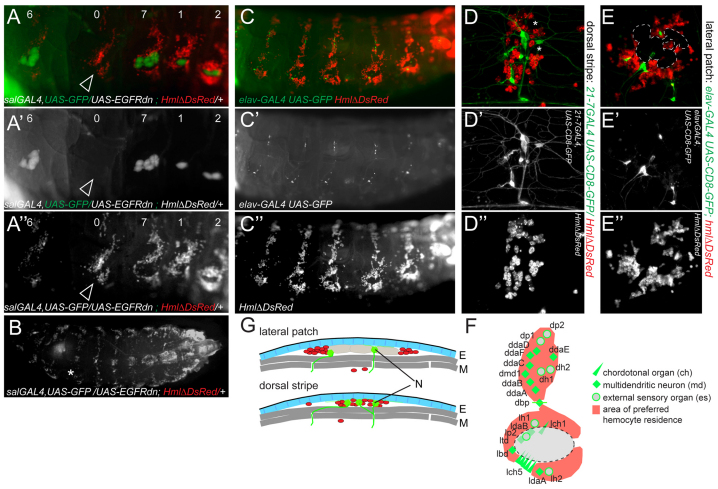
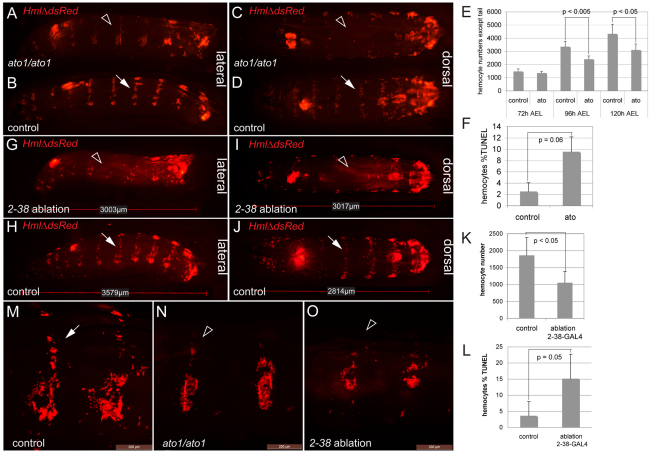
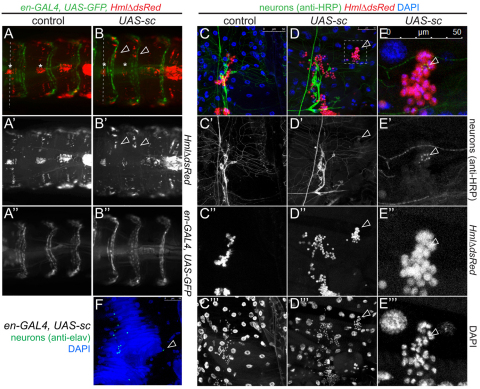
Interactions of hematopoietic cells with their microenvironment control blood cell colonization, homing and hematopoiesis. Here, we introduce larval hematopoiesis as the first Drosophila model for hematopoietic colonization and the role of the peripheral nervous system (PNS) as a microenvironment in hematopoiesis. The Drosophila larval hematopoietic system is founded by differentiated hemocytes of the embryo, which colonize segmentally repeated epidermal-muscular pockets and proliferate in these locations. Importantly, we show that these resident hemocytes tightly colocalize with peripheral neurons and we demonstrate that larval hemocytes depend on the PNS as an attractive and trophic microenvironment. atonal (ato) mutant or genetically ablated larvae, which are deficient for subsets of peripheral neurons, show a progressive apoptotic decline in hemocytes and an incomplete resident hemocyte pattern, whereas supernumerary peripheral neurons induced by ectopic expression of the proneural gene scute (sc) misdirect hemocytes to these ectopic locations. This PNS-hematopoietic connection in Drosophila parallels the emerging role of the PNS in hematopoiesis and immune functions in vertebrates, and provides the basis for the systematic genetic dissection of the PNS-hematopoietic axis in the future.


Figures

Fig. 1.
Fig. 1.
Organization of larval hemocytes in epidermal-muscular pockets. (A) Stage 17 embryo (srpHemoGAL4, UAS Stinger/+; svpAE127-lacZ/+) showing hemocytes (green), oenocytes (red) and nuclei (DAPI, blue). (B-E′) Time course and hemocyte pattern of Pxn-GAL4, UAS-GFP larvae. Bars indicate actual larval size. (B,B′) Early 1st instar, 24 hours AEL. (C,C′) Late 1st instar, 48 hours AEL. (D,D′) Late 2nd instar, 72 hours AEL. (E,E′) Mid 3rd instar, 96 hours AEL. Arrows indicate lateral patch in segment A5. P, lateral patch; S, dorsal stripe; T, terminal cluster; DV, dorsal-vessel-associated cluster. (F) Schematic (not to scale, lateral view) of larval development (see Hartenstein, 1993). Hemocytes (green), oenocyte clusters (pie-shaped, gray). (G) Lateral patch and dorsal stripe, ∼80 hours AEL, salGAL4,HmlDsRed; UAS-GFP. Oenocytes (green), hemocytes (red). (H) Corresponding area in schematic. (I) Cross-section of an epidermal-muscular pocket, lateral patch, 96 hours AEL. Phalloidin labels muscle layers (green), DAPI and autofluorescence mark nuclei and cuticle (blue). Hemocytes are shown in red (HmlΔDsRednls, arrows). Scale bar: 50 μm. (J) Schematic of panel I showing hemocytes (red, arrows) sandwiched between epidermis (E, blue) and muscle layers (M, dark gray), oenocytes (O, light gray) and a circulating hemocyte (open arrowhead). (K) Bled-out larva, HmlΔDs-Red, 96 hours AEL in which resident hemocytes remain. Asterisk indicates LG.
Fig. 2.
Fig. 2.
Dynamics of resident hemocyte clusters. (A-C) Re-formation of the resident hemocyte pattern after disturbance. Lateral view of larva HmlΔ-GAL4, UAS-GFP, 96 hours AEL. (A) Before disturbance. (B) Time 0 after disturbance. (C) Same segments, 30 minutes after disturbance. Arrow, lateral patch; arrowhead, dorsal stripe. (D) Expression of dominant-negative Rho1 in hemocytes. 96 hours AEL, HmlΔdsRed;Pxn-GAL4 × UAS-Rho1DN. (E-L′) EOS-FP tracing of local hemocyte populations, Pxn-GAL4, UAS-EOS-FP. (E) Timeline of posterior EOS-FP tracing (corresponding to F-G′). Vertical bars mark UV induction and observation. (F,F′) Time 0 after UV. (G,G′) Same larva 24 hours after UV. Red hemocytes can be found in areas anterior to the original photoconversion area (bracket). (H-I′) EOS-FP tracing of one individual lateral patch (asterisk), segment A4, 96 hours AEL. (H-I′) Time 0 after UV; (H,I) combined channels; (H′,I′) red channel only. (J-L′) Same larva at 4 hours after UV. Labeled hemocytes have moved to various lateral patches and dorsal stripes on the same and contralateral sides, and to dorsal-vessel-associated clusters (arrowheads). (J,K,L) combined channels; (J′,K′,L′) red channel only.
Fig. 3.
Fig. 3.
Larval hemocytes expand in the differentiated state. (A) Schematic of EOS-FP tracing of differentiated hemocytes, illustrating possible outcomes. (B) Timeline of EOS-FP labeling in the larva, corresponding to panels C-E′, marking UV switch (gray vertical bar) and observation (green vertical bar) times. (C-E′) Pxn-GAL4, UAS-EOS-FP. Dorsal views of a whole larva (C-E) and lateral close up of two segments (C′-E′) over time. (C,C′) Before UV. (D,D′) Time 0 after photoconversion. (E,E′) 24 hours after photoconversion, asterisk marks LG. There is incomplete overlap of channels due to minor movement of the larva. Anterior red areas in E reflect nonspecific expression in gastric cecae and proventriculus. (F) LG of UV-switched larva 24 hours after UV. (F′) LG of non-UV control. (G) Ex vivo quantification of EOS fluorescence in hemocytes of larvae similar to those shown in C-E′. (H) Fold increase in larval hemocyte numbers in EOS-red photoconverted hemocytes and EOS-green hemocytes from non-UV controls over the period of a 24-hour experiment. (I-J) Local UV photoconversion of the posterior end of a 3rd instar larva, followed by EdU feeding for 4 hours. (I-I′) Photoconverted larva. (J) EdU incorporation rates in EOS-red (i.e. UV-treated) and EOS-green-only (i.e. non-UV treated) hemocytes. (K) Timeline of EOS-FP labeling of stage 16 embryos. (L,L′) Time 0 after UV. Residual EOS-green and some autofluorescence in green channel. (M,M′) 1st instar larva ∼46 hours AEL from embryo in L. (N,N′) Non-UV control larva processed in parallel, 46 hours AEL. (O) Quantification of EOS-FP-green and -red in released hemocytes of experiment and non-UV controls shown in M-N′. (P-R) Consecutive phagocytosis and EdU incorporation assay. (P) HmlΔ-GAL4, UAS-GFP 3rd instar larvae injected with fluorescent latex beads, lateral view of live larva. (Q-Q′′) Released hemocytes from larva shown in P, after ex vivo EdU incorporation showing hemocytes (GFP, green), EdU (red, nuclear stain), fluorescent beads (red, cytoplasmic inclusions) and nuclear DAPI (blue). (R) Quantification of EdU incorporation in bead-positive and bead-negative hemocytes. Error bars represent s.d.
Fig. 4.
Fig. 4.
Hemocytes proliferate in resident sites. (A) In vivo EdU incorporation rates of circulating and resident hemocytes marked by HmlΔ-GAL4, UAS-GFP, omitting the developing LG. Larvae 72 hour AEL fed with EdU for 4 hours. (B) In vivo EdU incorporation in a lateral patch of an early 3rd instar, EdU-fed for 2 hours. EdU (red), Pxn-GAL4, UAS-GFP/UAS-lacZ (stained for β-Gal, green), DAPI (blue). (C-E′) In vivo labeling of proliferating hemocytes using UAS-S/G2/M-Green fucci. (C) S/G2/M-Green emits green fluorescence in the SG2-M phases of the cell cycle; quiescent cells in G1 are negative for fucci fluorescence. (D) HmlΔ-DsRed/CyO; Pxn-GAL4, UAS-S/G2/M-Green. Fucci-positive hemocytes among HmlΔ-DsRed positive circulating and resident hemocyte populations. At 48 hours AEL, all hemocytes are resident correlating with high fucci-positive rates. At 96 hours AEL, differences between resident and circulating hemocytes become insignificant, possibly owing to increased mobility and exchange between the hemocyte populations. (E-E′) Lateral hemocyte patches of a late 2nd instar larva. Pxn-GAL4, UAS-S/G2/M-Green (green), HmlΔ-DsRed (red). Error bars represent s.d.
Fig. 5.
Fig. 5.
Larval hemocytes colocalize with the PNS. (A-B) Oenocytes are dispensable for hemocyte attraction. Suppression of oenocyte specification by UAS-EGFRdn under control of sal-GAL4, visualization of remaining oenocytes by UAS-GFP. Numbers indicate the number of remaining oenocytes per segment. Note one segment that completely lacks oenocytes, yet hemocytes still accumulate (arrowhead). (A-A′) Lateral views. (B) Dorsal view, asterisk marks ‘0’ oenocyte segment. (C-G) Larval hemocytes co-localize with the PNS. (C-C′) Co-labeling of neurons (elav-GAL4, UAS-CD8-GFP in green) and hemocytes (HmlΔ-DsRed in red) in live larvae. (D-D′) Dorsal stripe, 21-7-GAL4, UAS-CD8-GFP/HmlΔDs-Red. Hemocytes (red), md neurons (green). Asterisks mark approximate positions of unlabeled es neurons (see also F). (E-E′) Lateral patch. elav-GAL4, UAS-CD8-GFP; HmlΔ-DsRed. Hemocytes localize next to lateral chordotonal organs; oenocytes marked by dashed outline. (F) Model of lateral and dorsal PNS neuron clusters and areas of hemocyte attraction (red) in abdominal segments A1-A7. External sense organs (es) and chordotonal organs (ch) are depicted by just one symbol each, representing neurons plus their accompanying support cells. (G) Model of hemocyte-PNS colocalization in the lateral patch and dorsal stripe areas. Hemocytes (red), neurons (N, green), epidermis (E, blue), oenocytes (light gray), muscle layers (M, dark gray).
Fig. 6.
Fig. 6.
The PNS as an attractive and trophic microenvironment for larval hemocytes. (A-D) ato1/ato1 homozygotes and heterozygous controls (early 3rd instar) imaged side-by-side. Dorsal stripes are almost completely absent in ato1/ato1 mutants (A,C, arrowheads) compared with controls (B,D, arrows). Genotypes are HmlΔ-DsRed/+; ato1 / ato1 for ato homozygous mutants and HmlΔ-DsRed/+; ato1 / TM3, Kr-GAL4, UAS-GFP for controls. (E) In vivo hemocyte counts in ato1 homozygotes and yw controls. (F) TUNEL rates of hemocytes from ato1 homozygotes and controls, 96 hours AEL. (G-L) Genetic ablation of peripheral neurons. Genotypes are 2-38-GAL4, UASCD8GFP, HmlΔ-DsRed/tub-GAL80ts; UAS-Dt1/+ for ablation and 2-38-GAL4, UASCD8GFP, HmlΔ-DsRed/+; tub-GAL80ts/+ for controls. (G-J) Lateral and dorsal views of early 3rd instar larvae, 2-38-GAL4 ablation (G,I) and control (H,J). Note absence of dorsal stripes (arrowhead). Dorsal stripe in control (arrow). (K) In vivo hemocyte counts in 2-38-GAL4 ablation and controls, early 3rd instar. (L) TUNEL rates of hemocytes from 2-38-GAL4 ablation and control larvae. (M-O) Lateral areas of control, ato1 and 2-38-GAL4 ablation larvae. Genotypes as above, 3rd instar larvae. Arrow, dorsal stripe in control larva; arrowheads, dorsal stripe in ato1 and 2-38-GAL4 ablation larvae. Scale bars: 200 μm. Error bars represent s.d.
Fig. 7.
Fig. 7.
Ectopic peripheral neurons attract larval hemocytes. (A-F) Overexpression of scute generates ectopic neurons that re-direct larval hemocytes. (A-A′,C-C′′) control. (B-B′,D-E′′) sc overexpression. Genotypes are en-GAL4, UAS-GFP, HmlΔDsRed/UAS-sc and en-GAL4, UAS-GFP, HmlΔDsRed/+ as control in A,B; en-GAL4, HmlΔDsRed/UAS-sc and HmlΔDsRed/+ as control in D,E. (A) Control; dorsal hemocyte stripes are in line (dashed line) with dorsal-vessel-associated hemocyte clusters (asterisks). (B) sc expression. Hemocytes accumulate in the posterior compartment of each segment (arrowheads relative to asterisks; dashed line marks wt position of hemocytes). (C-E′′) Double-labeling of PNS neurons (anti-HRP, green), hemocytes (red) and nuclei (DAPI, blue) in fillets of sc misexpressing and control larvae. (D-D′′) Ectopic neuron surrounded by cluster of hemocytes (arrowhead). (E-E′′) Close-up of region marked in D. (F) Ectopic neuron in sc misexpression larva positive for anti-Elav (green, arrowhead). DAPI (blue); en-GAL4/UAS-sc. Owing to extensive staining, hemocytes were lost from specimen.

Similar articles

Cited by

References

    1. Adams G. B., Scadden D. T. (2006). The hematopoietic stem cell in its place. Nat. Immunol. 7, 333–337 - PubMed
    1. Asha H., Nagy I., Kovacs G., Stetson D., Ando I., Dearolf C. R. (2003). Analysis of Ras-induced overproliferation in Drosophila hemocytes. Genetics 163, 203–215 - PMC - PubMed
    1. Ashburner M., Golic K. M., Hawley R. S. (2004). Drosophila: A Laboratory Handbook. New York: Cold Spring Harbor Laboratory Press;
    1. Babcock D. T., Brock A. R., Fish G. S., Wang Y., Perrin L., Krasnow M. A., Galko M. J. (2008). Circulating blood cells function as a surveillance system for damaged tissue in Drosophila larvae. Proc. Natl. Acad. Sci. USA 105, 10017–10022 - PMC - PubMed
    1. Banerjee S., Bhat M. A. (2007). Neuron-glial interactions in blood-brain barrier formation. Annu. Rev. Neurosci. 30, 235–258 - PMC - PubMed

Publication types

MeSH terms

LinkOut - more resources