. 2012 May;108(5):473-9.
doi: 10.1038/hdy.2011.108. Epub 2011 Nov 9.

Genetic correlations and the evolution of photoperiodic time measurement within a local population of the pitcher-plant mosquito, Wyeomyia smithii

Affiliations

Genetic correlations and the evolution of photoperiodic time measurement within a local population of the pitcher-plant mosquito, Wyeomyia smithii

W E Bradshaw et al. Heredity (Edinb). 2012 May.

Abstract

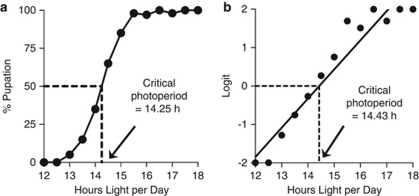
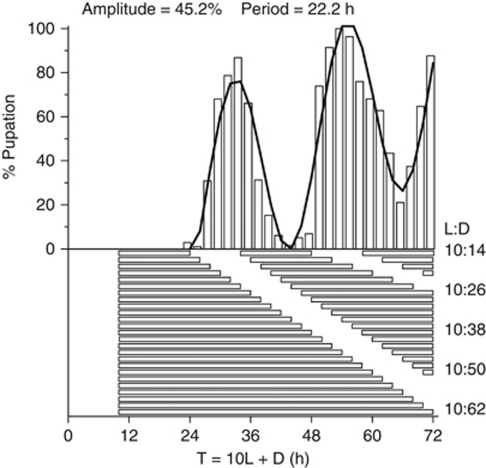
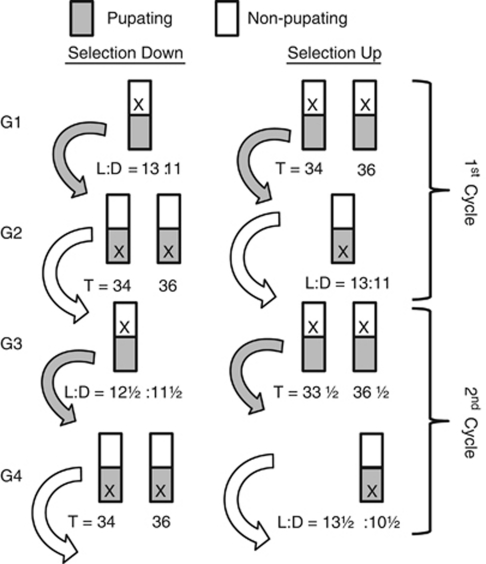
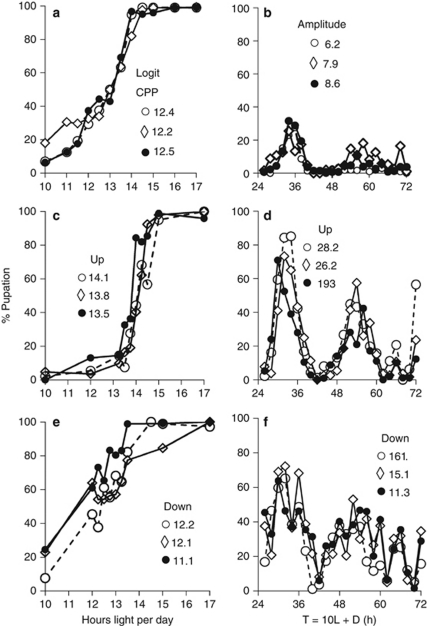
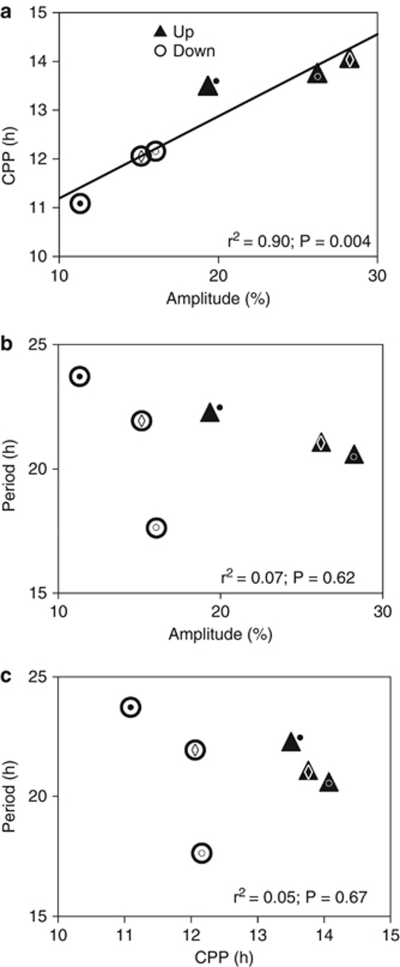
The genetic relationship between the daily circadian clock and the seasonal photoperiodic timer remains a subject of intense controversy. In Wyeomyia smithii, the critical photoperiod (an overt expression of the photoperiodic timer) evolves independently of the rhythmic response to the Nanda-Hamner protocol (an overt expression of the daily circadian clock) over a wide geographical range in North America. Herein, we focus on these two processes within a single local population in which there is a negative genetic correlation between them. We show that antagonistic selection against this genetic correlation rapidly breaks it down and, in fact, reverses its sign, showing that the genetic correlation is due primarily to linkage and not to pleiotropy. This rapid reversal of the genetic correlation within a small, single population means that it is difficult to argue that circadian rhythmicity forms the necessary, causal basis for the adaptive divergence of photoperiodic time measurement within populations or for the evolution of photoperiodic time measurement among populations over a broad geographical gradient of seasonal selection.


Figures

Figure 1
Figure 1
Critical photoperiod (CPP). (a) CPP is determined by exposing separate cohorts of diapausing larvae to different static day lengths and plotting percentage of pupation as a function of day length. Typically, the 50% intercept on the day-length axis defines the critical photoperiod, which is used as a proxy for the entire response curve. (b) Critical photoperiod defined as the 0 intercept on a logit scale, where Logit=Log10[%/(100−%)] and values of 0% and 100% are set equal to 1% and 99%, respectively. This definition takes into account the entire photoperiodic response curve.
Figure 2
Figure 2
Estimating amplitude and period of circadian rhythmicity from the rhythmic response to the Nanda–Hamner protocol (NH). The period of an oscillation is the peak-to-peak or valley-to-valley interval; the amplitude is half the peak-to-valley interval. Without both a significantly non-zero period and a significantly non-zero amplitude, there is no rhythm. In the NH protocol, separate cohorts are exposed to a short day followed, in separate experiments, by night lengths of increasing duration. Conceptually, if dawn after a long night falls within a rhythmically sensitive period, then a long-day response results and the circadian sensitivity rhythm is expressed as a rhythmic response to the NH protocol. ‘The Nanda-Hamner protocol is rather like a biological periodogram analysis whereby a covert biological oscillation is systematically probed by an experimental light-dark cycle with an increasing periodicity. The intervals between the peaks of high diapause [in the present example, high pupation], therefore, reflect the periodicity of the underlying circadian oscillator' (Saunders, 2010a, p 1493).
Figure 3
Figure 3
Antagonistic selection. The original genetic correlation (Bradshaw et al., 2003) was negative, that is, lines selected for long critical photoperiods resulted in a low response to NH and lines for short critical photoperiod resulted in a high response to NH. The object of antagonistic selection is to break up or reverse this negative correlation by selecting for short critical photoperiods with a low response to NH (selection down) and long critical photoperiods with a high response to NH (selection up). Selection is imposed for 10 generations (five cycles); the first two cycles of up- and down-selection are shown to illustrate the procedures. Selection Down: In the first generation of selection (G1), diapausing larvae are exposed to an L:D=13:11 cycle. Non-pupating larvae are discarded ( × ); pupating larvae are those responding to this day length, are used to calculate effective population size (Ne) for G1, and are used as parents for the next generation. This regimen selects for individuals with shorter critical photoperiods. In G2, diapausing larvae are exposed to L:D=10:24 and L:D=10:26 (T=34 and 36 h, respectively). Pupating larvae are discarded; non-pupating larvae are pooled and reared on long days; their resulting pupae are used to calculate Ne for G2; and their resulting adults are used to found the next generation. This regimen selects for a low response to NH. We use T=34 and 36 h because they bracket maximum response to NH (Figure 2), thereby maximizing selection for the height but not position of the peak. Together, G1 and G2 represent one cycle of antagonistic selection. G3 and G4 illustrate a second cycle of antagonistic selection, but with an increased intensity of selection: to be included in the subsequent generations, larvae must pupate under even shorter L:D cycles and continue to ignore otherwise development-stimulating T=34 and 36 h. Selection up: In G1, diapausing larvae are exposed to L:D=10:24 and L:D=10:26. Non-pupating larvae are discarded ( × ); pupating larvae are those responding to these T=34 and 36 h. Pupae are combined, are used to calculate effective population size (Ne) for G1, and are used as parents for the next generation. This regimen selects for individuals with a high response to NH. In G2, diapausing larvae are exposed to L:D=13:11. Pupating larvae are discarded; non-pupating larvae are pooled and placed on long days; their resulting pupae are used to calculate Ne for G2; and, their resulting adults are used to found the next generation. This regimen selects for a longer critical photoperiod. G3 and G4 illustrate a second cycle of antagonistic selection, but with an increased intensity of selection: to be included in subsequent generations, larvae must not pupate under even longer L:D cycles and continue to pupate in response to even more divergent T cycles.
Figure 4
Figure 4
Hybrid phenotypes before and after antagonistic selection. Photoperiodic response (a, c, e) and response to the NH protocol (b, d, f). (a, b) Before selection; (c, d) after antagonistic selection for long CPP and high amplitude (Up); (e, f) after antagonistic selection for short CPP and low amplitude (Down). CPPs (h) determined from logits; amplitudes of the rhythm from non-linear regression (% pupation). T=the total duration of light plus dark for each cycle. In all cases, the regression coefficients for the determination of critical photoperiod were significantly greater than zero (P⩽0.001). In all cases both the amplitude (P<0.003) and the period (P<0.001) were significantly non-zero, that is, NH always elicited a rhythmic response. Sample sizes±s.d. before selection averaged 92±7 larvae per day length for CPPs and 92±9 larvae per T-cycle for NH; sample sizes±s.d. after selection averaged 94±18 larvae per day length for CPPs and 86±12 larvae per T-cycle for NH. Data are provided in Supplementary Tables S1–S7. Symbols distinguish among ○ East, • West and ◊ North lines.
Figure 5
Figure 5
Correlation among critical photoperiod (CPP) and the amplitude and period of the rhythmic response to the Nanda-Hamner protocol in the up- and down-selected lines within the Pine Barrens population. (a) Importantly, antagonistic selection rapidly reverses the sign of the previously determined (Bradshaw et al., 2003) genetic correlation between critical photoperiod (a measure of the seasonal photoperiodic timer) and amplitude of the rhythmic response to the Nanda-Hamner protocol (a measure of the daily circadian clock). At the same time, antagonistic selection does not generate a correlated response in period of the rhythmic response with either its amplitude (b) or with critical photoperiod (c). Details of ANOVAs are provided in Supplementary Table S8, and regressions in Supplementary Table S9. Symbols distinguish among ○ East, • West and ◊ North lines.

Comment in

References

    1. Bradshaw WE, Haggerty BP, Holzapfel CM. Epistasis underlying a fitness trait within a natural population of the pitcher-plant mosquito, Wyeomyia smithii. Genetics. 2005;169:485–488. - PMC - PubMed
    1. Bradshaw WE, Holzapfel CM. Genetic shift in photoperiodic response correlated with global warming. Proc Nat Acad Sci USA. 2001;98:14509–14511. - PMC - PubMed
    1. Bradshaw WE, Holzapfel CM. Evolution of animal photoperiodism. Annu Rev Ecol Evol Syst. 2007a;38:1–25.
    1. Bradshaw WE, Holzapfel CM. Tantalizing timeless. Science. 2007b;316:1851–1852. - PubMed
    1. Bradshaw WE, Holzapfel CM. What season is it anyway? Circadian tracking vs photoperiodic anticipation in insects. J Biol Rhythms. 2010a;25:155–165. - PubMed

Publication types

Substances