. 2012 Mar;51(3):207-18.
doi: 10.1002/gcc.20945. Epub 2011 Nov 10.

High prevalence of CIC fusion with double-homeobox (DUX4) transcription factors in EWSR1-negative undifferentiated small blue round cell sarcomas

Affiliations

High prevalence of CIC fusion with double-homeobox (DUX4) transcription factors in EWSR1-negative undifferentiated small blue round cell sarcomas

Antoine Italiano et al. Genes Chromosomes Cancer. 2012 Mar.

Abstract

Primitive round cell sarcomas of childhood and young adults have been problematic to diagnose and classify. Our goal was to investigate the pathologic and molecular characteristics of small blue round cell tumors (SBRCT) that remained unclassified after exhaustive immunohistochemistry and molecular screening to exclude known sarcoma-related translocations. As rare examples of EWSR1-negative SBRCT have been shown to carry rearrangements for FUS and CIC genes, we undertook a systematic screening for these two genes. CIC rearrangements by FISH were detected in 15/22 (68%), while none showed FUS abnormalities. RACE, RT-PCR, and/or long-range DNA PCR performed in two cases with frozen material showed that CIC was fused to copies of the DUX4 gene on either 4q35 or 10q26.3. Subsequent FISH analysis confirmed fused signals of CIC with either 4q35 or 10q26.3 region in six cases each. Tumors positive for CIC-DUX4 fusion occurred mainly in male young adult patients (median age: 29 years), with the extremities being the most frequent location. Microscopically, tumors displayed a primitive, round to oval cell morphology with prominent nucleoli, high mitotic count, and areas of necrosis. O13 expression was variable, being either diffuse or patchy and tumors mostly lacked other markers of differentiation. Although CIC-DUX4 resulting in a t(4;19) translocation has been previously described in primitive sarcomas, this is the first report implicating the related DUX4 on 10q26 in oncogenesis. These results suggest the possibility of a newly defined subgroup of primitive round cell sarcomas characterized by CIC rearrangements, distinct from Ewing sarcoma family of tumors.


Figures

Figure 1
Figure 1
Morphologic appearance of CIC-rearranged lesions. A. Tumor composed of mixed round and oval cells, displaying less monomorphic cytomorphology compared to EFT, with a higher degree of variability in nuclear size and shape (SBRCT 9, 200x); B. rare tumors showed areas of short spindle cells, arranged in a vague storiform pattern without a well-defined fascicular growth (SBRCT 7, 100x); C. although most tumors cells had scant cytoplasm, this lesion showed focally sheets of round cells with moderate amount of amphophilic cytoplasm, with eccentric nuclei, with open chromatin and prominent nucleoli (SBRCT 3, 200x); D. high magnification showing uniform round cells with open, vesicular chromatin and eosinophilic, macronucleoli (SBRCT 14, 400x); E. although most tumors showed geographic areas of necrosis, few tumors showed a distinctive ‘starry-sky’ appearance due to individual tumor cells necrosis (SBRCT 7, 200x); F. O13 immunostaining showing patchy areas of reactivity (SBRCT 9, 200x).
Figure 2
Figure 2
CIC gene rearrangements and fusion with candidate genes on 4q35 and 10q26.3 by FISH. A. Split-apart signal in a CIC-rearranged tumor; upper-right showing location and designation of BACs flanking CIC, three on each side (labeled with red, centromeric and with green, telomeric); B. fused yellow signal, resulting from the fusion of telomeric CIC in green with centromeric portion of DUX4 in red, on chromosome 4q35; C. fused signal of telomeric CIC (green) to centromeric DUX4 in red on chromosome 10q26.3.
Figure 3
Figure 3
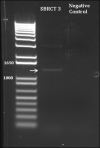
Long range genomic PCR of CIC-DUX4 in SBRCT 3. An 1,296 bp was amplified by LR-PCR and shown by gel electrophoresis (A), which by Sanger sequencing confirmed the fusion of 5′ portion of CIC exon 20 with DUX4 exon 1 on 4q35; * represents a short fragment between CIC and DUX4 breakpoints, which matches the anti-parallel 4760-4782 region of CIC exon 20 (B). Comparative analysis of the D4Z4 genomic sequence between 4q35 (including the sequence obtained from SBRCT 3; position 1 represents the DUX4 breakpoint) and 10q35 (including the sequence from SBRCT 9; position 374 represents the distance from the DUX4 breakpoint) shows deletions in the CDS region of D4Z4 of 10q26 but not in 4q35(C).
Figure 3
Figure 3
Long range genomic PCR of CIC-DUX4 in SBRCT 3. An 1,296 bp was amplified by LR-PCR and shown by gel electrophoresis (A), which by Sanger sequencing confirmed the fusion of 5′ portion of CIC exon 20 with DUX4 exon 1 on 4q35; * represents a short fragment between CIC and DUX4 breakpoints, which matches the anti-parallel 4760-4782 region of CIC exon 20 (B). Comparative analysis of the D4Z4 genomic sequence between 4q35 (including the sequence obtained from SBRCT 3; position 1 represents the DUX4 breakpoint) and 10q35 (including the sequence from SBRCT 9; position 374 represents the distance from the DUX4 breakpoint) shows deletions in the CDS region of D4Z4 of 10q26 but not in 4q35(C).
Figure 4
Figure 4
Demonstration of novel t(10;19) translocation resulting in CIC-DUX4 fusion in SBRCT 9. (A) RACE results identified the 5′ portion of CIC exon 20 fused to the first nucleotide of DUX4 exon 2 on 10q26.3; (B) RT-PCR confirmed an identical breakpoint and sequence, here illustrated by a 231 bp amplified product; (C) Diagrammatic representation of the LR-PCR results, confirming the fusion of 301 bp of CIC exon 20 to 662 bp of DUX4 exon 1. The break point in DUX4 was located at the distal end of the last D4Z4 repeat. The BlnI+(CCTAGG) restriction site identified in exon 2 is shown in bolded black font; BlnI+ D4Z4 unit is typically present in chromosome10, compared to the D4Z4 BlnI-pattern in chr. 4 (Lemmers et al., 2010b). The underlined sequence in the pLAM region (exon 3) highlights the proposed polyadenylation site (Lemmers et al., 2010a). (D) Schematic representation of genomic sequence of DUX4 on chromosome 10, adapted from (Snider et al., 2010) showing the break within exon 1 of DUX4 (lightning bolt symbol). The sites of polyadenylation signals: ATCAAA, ATTTAA, CTAGCG, and TTTAAA, depicted by arrows, as described by (Lemmers et al., 2010a), and http://www.imtech.res.in/raghava/polyapred/index.html). Lower part illustrates the DUX4 transcript variants identified by RACE among the CIC-DUX4 fusion products of SBRCT 9; the predominant transcript (DUX4 exon 2-exon 6) being depicted in the ABI sequence in (A).
Figure 4
Figure 4
Demonstration of novel t(10;19) translocation resulting in CIC-DUX4 fusion in SBRCT 9. (A) RACE results identified the 5′ portion of CIC exon 20 fused to the first nucleotide of DUX4 exon 2 on 10q26.3; (B) RT-PCR confirmed an identical breakpoint and sequence, here illustrated by a 231 bp amplified product; (C) Diagrammatic representation of the LR-PCR results, confirming the fusion of 301 bp of CIC exon 20 to 662 bp of DUX4 exon 1. The break point in DUX4 was located at the distal end of the last D4Z4 repeat. The BlnI+(CCTAGG) restriction site identified in exon 2 is shown in bolded black font; BlnI+ D4Z4 unit is typically present in chromosome10, compared to the D4Z4 BlnI-pattern in chr. 4 (Lemmers et al., 2010b). The underlined sequence in the pLAM region (exon 3) highlights the proposed polyadenylation site (Lemmers et al., 2010a). (D) Schematic representation of genomic sequence of DUX4 on chromosome 10, adapted from (Snider et al., 2010) showing the break within exon 1 of DUX4 (lightning bolt symbol). The sites of polyadenylation signals: ATCAAA, ATTTAA, CTAGCG, and TTTAAA, depicted by arrows, as described by (Lemmers et al., 2010a), and http://www.imtech.res.in/raghava/polyapred/index.html). Lower part illustrates the DUX4 transcript variants identified by RACE among the CIC-DUX4 fusion products of SBRCT 9; the predominant transcript (DUX4 exon 2-exon 6) being depicted in the ABI sequence in (A).

References

    1. Alaggio R, Bisogno G, Rosato A, Ninfo V, Coffin CM. Undifferentiated sarcoma: does it exist? A clinicopathologic study of 7 pediatric cases and review of literature. Hum Pathol. 2009;40:1600–1610. - PubMed
    1. Antonescu CR, Zhang L, Chang NE, Pawel BR, Travis W, Katabi N, Edelman M, Rosenberg AE, Nielsen GP, Dal Cin P, Fletcher CD. EWSR1-POU5F1 fusion in soft tissue myoepithelial tumors. A molecular analysis of sixty-six cases, including soft tissue, bone, and visceral lesions, showing common involvement of the EWSR1 gene. Genes Chromosomes Cancer. 2010;49:1114–1124. - PMC - PubMed
    1. Balamuth NJ, Womer RB. Ewing’s sarcoma. Lancet Oncol. 2010;11:184–192. - PubMed
    1. Berg T, Kalsaas AH, Buechner J, Busund LT. Ewing sarcoma-peripheral neuroectodermal tumor of the kidney with a FUS-ERG fusion transcript. Cancer Genet Cytogenet. 2009;194:53–57. - PubMed
    1. Blay JY, Le Cesne A. Adjuvant chemotherapy in localized soft tissue sarcomas: still not proven. Oncologist. 2009;14:1013–1020. - PubMed

Publication types

MeSH terms

Supplementary concepts