. 2012 Jan;107(2):677-91.
doi: 10.1152/jn.00762.2011. Epub 2011 Nov 9.

A critical window of CAG repeat-length correlates with phenotype severity in the R6/2 mouse model of Huntington's disease

Affiliations

A critical window of CAG repeat-length correlates with phenotype severity in the R6/2 mouse model of Huntington's disease

Damian M Cummings et al. J Neurophysiol. 2012 Jan.

Abstract

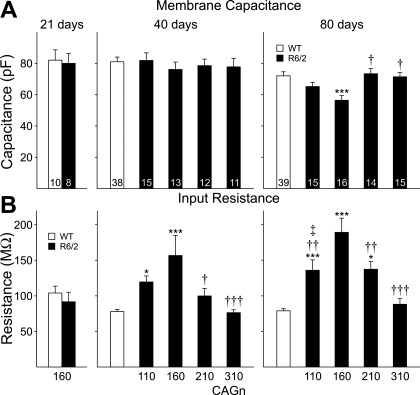
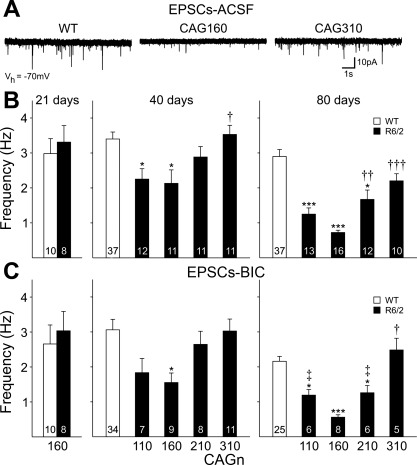
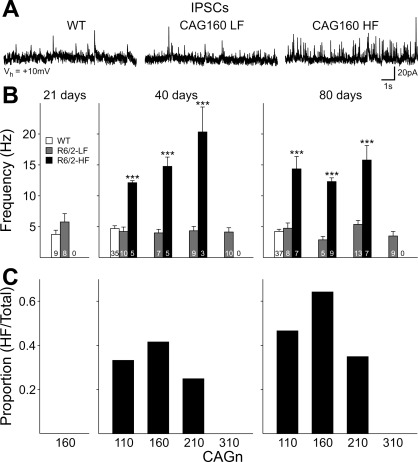
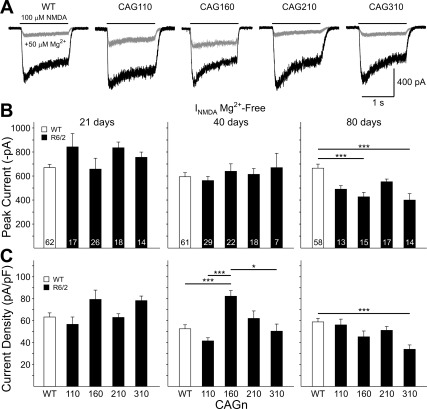
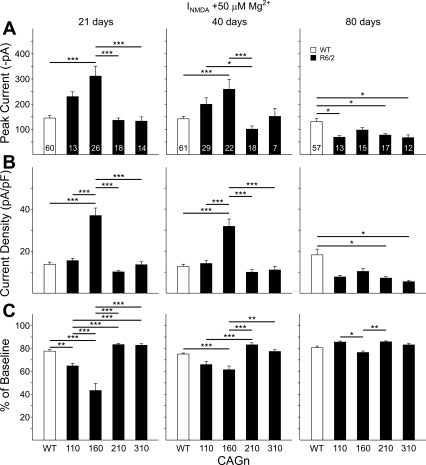
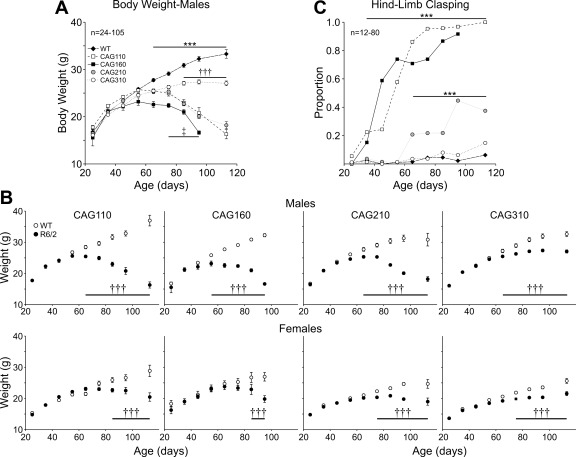
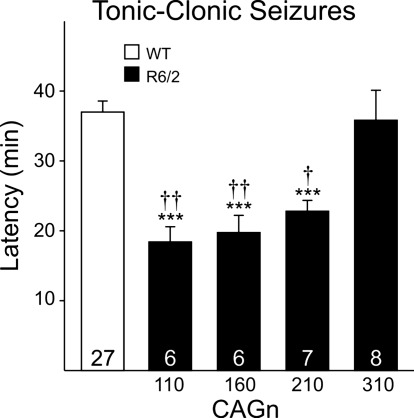
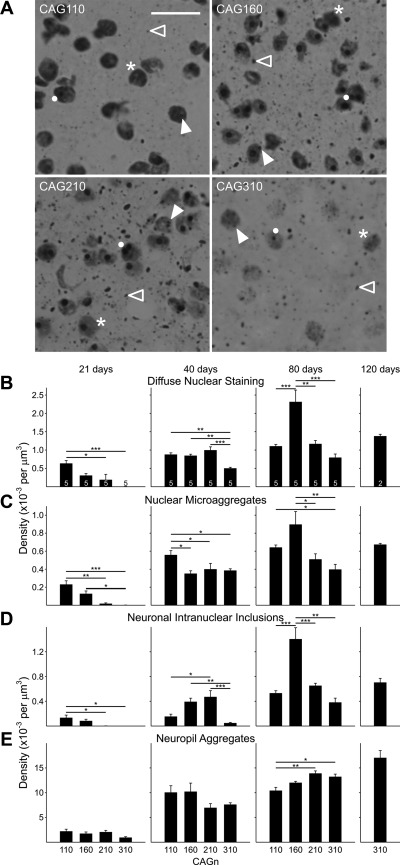
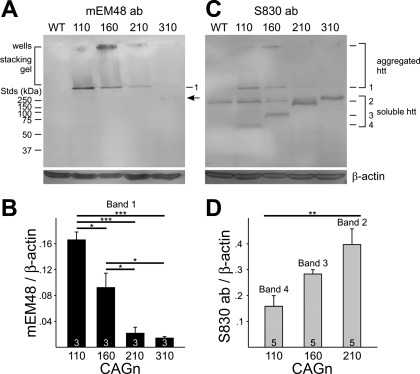
The R6/2 mouse is the most frequently used model for experimental and preclinical drug trials in Huntington's disease (HD). When the R6/2 mouse was first developed, it carried exon 1 of the huntingtin gene with ~150 cytosine-adenine-guanine (CAG) repeats. The model presented with a rapid and aggressive phenotype that shared many features with the human condition and was particularly similar to juvenile HD. However, instability in the CAG repeat length due to different breeding practices has led to both decreases and increases in average CAG repeat lengths among colonies. Given the inverse relationship in human HD between CAG repeat length and age at onset and to a degree, the direct relationship with severity of disease, we have investigated the effect of altered CAG repeat length. Four lines, carrying ~110, ~160, ~210, and ~310 CAG repeats, were examined using a battery of tests designed to assess the basic R6/2 phenotype. These included electrophysiological properties of striatal medium-sized spiny neurons, motor activity, inclusion formation, and protein expression. The results showed an unpredicted, inverted "U-shaped" relationship between CAG repeat length and phenotype; increasing the CAG repeat length from 110 to 160 exacerbated the R6/2 phenotype, whereas further increases to 210 and 310 CAG repeats greatly ameliorated the phenotype. These findings demonstrate that the expected relationship between CAG repeat length and disease severity observed in humans is lost in the R6/2 mouse model and highlight the importance of CAG repeat-length determination in preclinical drug trials that use this model.


Figures

Fig. 1.
Fig. 1.
Cell membrane capacitance (A) and input resistance (B) for medium-sized spiny neurons (MSNs) recorded in acute slices prepared from R6/2s and pooled wild-types (WTs) at 21, 40, and 80 days of age. *P < 0.05, ***P < 0.001 with respect to WTs; †P < 0.05, ††P < 0.01, †††P < 0.001 with respect to cytosine-adenine-guanine (CAG)160; ‡P < 0.05 with respect to CAG310. In Figs. 1–5, numbers within bars indicate the number of cells.
Fig. 2.
Fig. 2.
A: typical traces recorded in gap-free mode at −70 mV membrane holding potential [Vhold (Vh)] in standard artificial cerebrospinal fluid (ACSF). EPSC, excitatory postsynaptic current. Traces were obtained from WT, CAG160, and CAG310 R6/2 mice at 80 days. B: bar graphs show mean (±SE) spontaneous EPSC frequency recorded in standard ACSF for each group at the ages indicated. C: bar graphs show mean (±SE) spontaneous EPSC frequency recorded in standard ACSF with 20 μM bicuculline methobromide (BIC) for each group at the ages indicated. At 21 days, in both B and C, data were obtained only from the CAG160 line and their WTs. *P < 0.05, ***P < 0.001 with respect to WT; †P < 0.05, ††P < 0.01, †††P < 0.001 with respect to CAG160; ‡P < 0.05 with respect to CAG310.
Fig. 3.
Fig. 3.
A: typical traces recorded in gap-free mode at +10 mV membrane Vhold in standard ACSF for MSNs with low-frequency (LF) and high-frequency (HF) inhibitory postsynaptic currents (IPSCs) from CAG160 R6/2s at 80 days and an age-matched WT. B: bar graphs show mean (±SE) spontaneous IPSC frequency for LF and HF cells for each CAG repeat line at the ages indicated. At 21 days, data were obtained only from the CAG160 line and their WTs. ***P < 0.001 with respect to WT. C: proportion of HF cells in each CAG repeat line.
Fig. 4.
Fig. 4.
A: examples of typical current traces of acutely isolated MSNs in response to the application of 100 μM N-methyl-d-aspartate (INMDA) in the absence (black traces) and presence (gray traces) of 50 μM Mg2+ for a WT, CAG110, CAG160, CAG210, and CAG310 R6/2 at 21 days of age. B: mean (±SE) peak current amplitude in Mg2+-free ACSF for pooled WTs and each CAG repeat group at 21, 40, and 80 days. C: mean (±SE) peak current density (peak current/capacitance) for the same groups shown in B. Lines over bars indicate statistically significant group comparisons: *P < 0.05, ***P < 0.001. Data from 21- and 40-day CAG160 lines were published previously (Starling et al. 2005).
Fig. 5.
Fig. 5.
A: mean (±SE) peak current amplitude in ACSF containing 50 μM Mg2+ for pooled WTs and each CAG repeat group at 21, 40, and 80 days. Example traces are shown in Fig. 4. B: mean (±SE) peak current density (peak current/capacitance) for the same groups shown in A. C: mean (±SE) percent reduction in peak current produced by the addition of 50 μM Mg2+ in the ACSF for the same groups shown in A and B. Lines over bars indicate statistically significant group comparisons: *P < 0.05, **P < 0.01, ***P < 0.001. Data from 21- and 40-day CAG160 line were published previously (Starling et al. 2005).
Fig. 6.
Fig. 6.
A: body weight of male mice divided into 10-day age bins. WTs are pooled from all R6/2 lines. Line with *** indicates age range at which WTs are significantly heavier than mice from all 4 CAG repeat lines (P < 0.05–P < 0.001). Line with ††† indicates age range at which CAG110, CAG160, and CAG210 lines have significantly lost more weight than CAG310 mice (P < 0.05–P < 0.001). Line with ‡ indicates age range at which CAG160 mice have significantly lost more weight than CAG 110 and CAG210 mice. B: body weights of male (top) and female (bottom) R6/2 and WT mice of each respective CAG repeat line plotted against age (binned in 10-day age groups). Significant difference is indicated between R6/2 and respective WT: †††P < 0.001. C: proportion of mice displaying hind-limb clasping in each of the 4 CAG repeat lines and pooled WTs. Data have been divided into 10-day age bins. Line with *** indicates age range for statistically significant differences from WTs for both the CAG110 and CAG160 lines (top line) and CAG210 line (bottom line).
Fig. 7.
Fig. 7.
A: latency to fall from an accelerating rotarod. B: latency to complete the pole-test task (time taken to turn, plus time taken to descend pole). In this (and see Figs. 8 and 9), numbers within the bars indicate the number of animals tested. Significance from WT (asterisks), significance from CAG110 line (daggers), significance from CAG160 line (double-dagger); */†/‡P < 0.05, **/††P < 0.01, ***/†††P < 0.001. Data from WTs have been pooled. Note the reduction in sample sizes in progressive age groups resulting from euthanasia due to advanced phenotypic progression or use for electrophysiology.
Fig. 8.
Fig. 8.
Latency to tonic-clonic seizure in 40-day male mice from each CAG repeat line and for a pooled WT group. Statistically significant differences from WTs (asterisks), significance from CAG310 mice (daggers); ***P < 0.001, †P < 0.05, ††P < 0.01.
Fig. 9.
Fig. 9.
A: photomicrographs of EM48-stained striatal sections from 80-day-old mice. Each image shows an example of a diffusely stained nucleus (asterisk), a nuclear microaggregate (closed arrowhead), a neuronal intranuclear inclusion (NII; solid dot), and a neuropil aggregate (open arrowhead). Note that an individual cell could be counted multiple times. For example, a cell may contain 2 NIIs, may also contain nuclear microaggregates, or also have diffuse nuclear staining. Original scale bar (in CAG110 image) is 10 μm and refers to all images. B–E: mean (±SE) density plotted at each age and for each protein conformation for the 4 different CAG repeat lengths. Sample size (number of animals) is indicated in B as numbers inside (or above) the bar. Lines over bars indicate statistically significant group comparisons: *P < 0.05, **P < 0.01, ***P < 0.001.
Fig. 10.
Fig. 10.
A: Western blots of striatal extracts from 40-day-old mice using the mouse EM48 (mEM48) antibody (ab). Note the presence of 3 polypeptide bands: in the loading wells, at ∼300 kDa (band 1), and at ∼175 kDa [arrow; evident in the CAG310 mouse line; standards (Stds) are on the left of the blot]. Striata from 3 mice at each of the 4 different CAG repeat R6/2 lines, plus 2 WT counterparts, were analyzed. B: intensities of the ∼300-kDa aggregated band (band 1) for each CAG repeat line were normalized to β-actin, and means (±SE) are plotted. Significance is indicated by *P < 0.05, ***P < 0.001. C: Western blots of striatal extracts from 21-day-old mice using the S830 antibody. Likely aggregated huntingtin (htt) is detected again in the wells and at ∼300 kDa, 1,046 corresponding to band 1, previously detected with mEM48 antibody in A. New bands 2, 3, and 4, corresponding in size to ∼120, 90, and 60 kDa, respectively, soluble forms of htt, are uniquely expressed in the CAG210, CAG160, and CAG110 R6/2 mouse lines, respectively. An additional, soluble htt band, similar in size to the ∼175 kDa detected with the mEM48 antibody (A), was also evident in the CAG310 line but was not quantified due to an obscuring nearby common band found in the WT fractions. Striata from 5 mice of each of the 4 different CAG repeat R6/2 mice were analyzed. D: intensities of the bands 2, 3, and 4 uniquely detected in each of the CAG210, 160, 110 repeat lines, respectively, were normalized to β-actin and means (±SE) plotted. Significance is indicated by **P = 0.007.

References

    1. Alonso ME, Yescas P, Cisneros B, Martinez C, Silva G, Ochoa A, Montanez C. Analysis of the (CAG)n repeat causing Huntington's disease in a Mexican population. Clin Genet 51: 225–230, 1997 - PubMed
    1. Andresen JM, Gayan J, Djousse L, Roberts S, Brocklebank D, Cherny SS, Cardon LR, Gusella JF, MacDonald ME, Myers RH, Housman DE, Wexler NS. The relationship between CAG repeat length and age of onset differs for Huntington's disease patients with juvenile onset or adult onset. Ann Hum Genet 71: 295–301, 2007 - PubMed
    1. Ariano MA, Cepeda C, Calvert CR, Flores-Hernandez J, Hernandez-Echeagaray E, Klapstein GJ, Chandler SH, Aronin N, DiFiglia M, Levine MS. Striatal potassium channel dysfunction in Huntington's disease transgenic mice. J Neurophysiol 93: 2565–2574, 2005 - PubMed
    1. Bates GP, Hockly E. Experimental therapeutics in Huntington's disease: are models useful for therapeutic trials? Curr Opin Neurol 16: 465–470, 2003 - PubMed
    1. Benn CL, Landles C, Li H, Strand AD, Woodman B, Sathasivam K, Li SH, Ghazi-Noori S, Hockly E, Faruque SM, Cha JH, Sharpe PT, Olson JM, Li XJ, Bates GP. Contribution of nuclear and extranuclear PolyQ to neurological phenotypes in mouse models of Huntington's disease. Hum Mol Genet 14: 3065–3078, 2005 - PubMed

Publication types

MeSH terms