. 2012 Jan 12;119(2):388-98.
doi: 10.1182/blood-2011-03-341081. Epub 2011 Nov 9.

Identification and characterization of Hoxa9 binding sites in hematopoietic cells

Affiliations

Identification and characterization of Hoxa9 binding sites in hematopoietic cells

Yongsheng Huang et al. Blood. .

Abstract

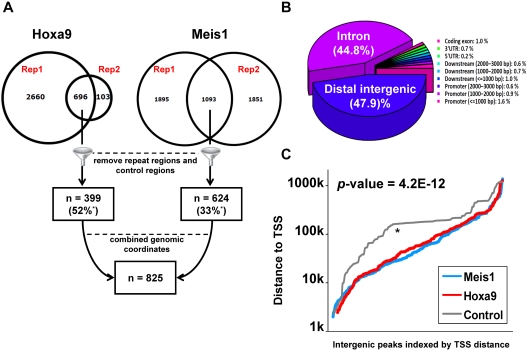
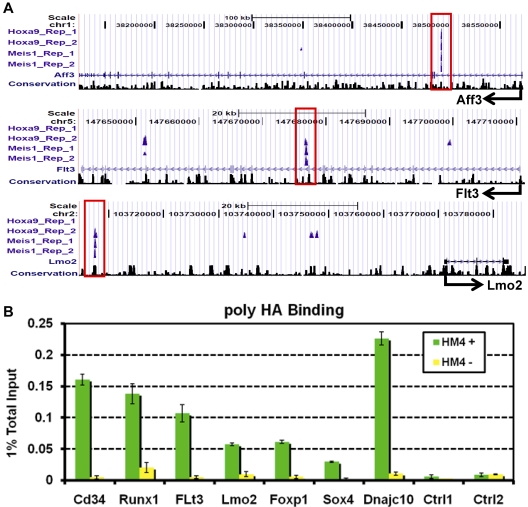
The clustered homeobox proteins play crucial roles in development, hematopoiesis, and leukemia, yet the targets they regulate and their mechanisms of action are poorly understood. Here, we identified the binding sites for Hoxa9 and the Hox cofactor Meis1 on a genome-wide level and profiled their associated epigenetic modifications and transcriptional targets. Hoxa9 and the Hox cofactor Meis1 cobind at hundreds of highly evolutionarily conserved sites, most of which are distant from transcription start sites. These sites show high levels of histone H3K4 monomethylation and CBP/P300 binding characteristic of enhancers. Furthermore, a subset of these sites shows enhancer activity in transient transfection assays. Many Hoxa9 and Meis1 binding sites are also bound by PU.1 and other lineage-restricted transcription factors previously implicated in establishment of myeloid enhancers. Conditional Hoxa9 activation is associated with CBP/P300 recruitment, histone acetylation, and transcriptional activation of a network of proto-oncogenes, including Erg, Flt3, Lmo2, Myb, and Sox4. Collectively, this work suggests that Hoxa9 regulates transcription by interacting with enhancers of genes important for hematopoiesis and leukemia.


Figures

Figure 1
Figure 1
Genome-wide identification of Hoxa9 and Meis1 binding sites in leukemia cells. (A) Schematic diagram of Hoxa9 and Meis1 binding site identification. Two replicate sequencing runs were performed for each factor, and the enriched regions (or peaks) were selected only if they were detected in both biologic replicates, consistent with ENCODE Consortium standard. The peaks from both factors were subsequently merged into one set of peaks (n = 825). Notably, a total of 52% of Hoxa9 peaks overlap with Meis1 peaks and 33% of Meis1 peaks overlap with Hoxa9 peaks. (B) Characterization of genomic localization of Hoxa9 and Meis1 binding sites. (C) Cumulative distribution of genomic localization indicates that Hoxa9 (red) and Meis1 (blue) binding sites are significantly (Kolmogorov-Smirnov test) closer to transcription start sites, compared with control peaks (gray).
Figure 2
Figure 2
Validation of Hoxa9 and Meis1 binding sites identified by ChIP-Seq. (A) For each binding site, enrichment profiles are shown for 2 replicates of Hoxa9 and Meis1 ChIP-Seq, with corresponding genomic annotation displayed as UCSC mm8 tracks at the Aff3, Flt3, and Lmo2 loci. A locus is deemed a high-confidence Hoxa9 and Meis1 binding site if it is bound by either Hoxa9 or Meis1in both of the replicate sequencing runs. The sequence tags of nonsignificant peak regions (FDR P < .01) are not displayed. The binding sites are highly conserved as shown by the Phastcon17 conservation track below. No significant binding was detected in the 2 control lanes at any of the regions shown. (B) Confirmation of selected Hoxa9 and Meis1 binding sites by ChIP and quantitative PCR. ChIP experiments were performed with polyclonal anti-HA Abs on HA epitope-tagged Hoxa9-ER/Meis1–transformed myeloblastic cell (HM4) used for ChIP-Seq experiments as described in “Experimental procedures.” Green bars represent PCR signal as a percentage of input for ChIP on cells cultured for 96 hours in the presence of 4-OHT, whereas yellow bars represent ratios for cells cultured for 96 hours in the absence of 4-OHT. These experiments show that Hoxa9 binds at high levels to ChIP-Seq–identified binding sites but not at control peaks and that the Hoxa9 enrichment disappears on 4-OHT withdrawal.
Figure 3
Figure 3
Hoxa9 and Meis1 binding sites show high regulatory potential and carry the epigenetic signature of enhancer sequences. (A) Regulatory potential scores are high at the center of Hoxa9 and Meis1 binding with correlation of 0.81 (P < .0001). The lines depict average of regulatory potential scores (blue) and sequencing reads in a ± 4-kb region centered at Hoxa9 and Meis1 binding sites. (B) Spatial distribution of epigenetic modifications surrounding high-confidence Hoxa9 and Meis1 binding sites. Epigenetic modification status was examined in ± 4-kb regions centered on Hoxa9 and Meis1 binding loci with the use of a custom Nimblegen tiling array. The normalized log2 ratios of a modification marker over input are shown relative to the center of the binding sites. (C) Spatial distribution of epigenetic modifications at the promoter region (+ 1 kb upstream and − 2 kb downstream) of a selected set of 360 genes that are closest to Hoxa9 and Meis1 binding sites. The normalized log2 ratio of a modification marker over input are shown for each nucleotide with respect to their distance to the transcription start sites. (D) The 3-dimensional projection of 7 epigenetic modification markers at the Hoxa9 and Meis1 binding sites with the use of principal component analysis. The first 3 principal components account for 82.1% of the total variance. The figure shows the loadings of each epigenetic modification on these components. The p300, CBP, H3K4me1 epigenetic signature that is characteristic of enhancer sequences includes > 65% of all Hoxa9 and Meis1 binding sites.
Figure 4
Figure 4
Heatmap showing temporal expression of subset of Hoxa9-regulated genes closely associated with Hoxa9 and Meis1 binding sites. A subset of genes are shown that are significantly differentially expressed over the 120-hour period after 4-OHT withdrawal (FDR P < .05 and median fold change > 1.5) compared with controls. Data are normalized across samples such that the expression value of each individual gene has zero mean and SD of 1. Many of the up-regulated genes shown have been directly implicated in leukemogenesis in both human studies and animal models (see text). Many of the down-regulated genes are involved in myeloid differentiation. Heatmaps of the entire set of differentially regulated genes are provided in supplemental Figure 4, and additional information on statistical analysis is provided in supplemental Data.
Figure 5
Figure 5
De novo motif discovery of TF motifs in Hoxa9 and Meis1 binding sites and comparison to previously characterized macrophage enhancer sequences. (A) Six de novo DNA sequence motifs and their STAMP logos and enrichment statistics, including observed frequencies and similarity measures. A complete list of de novo motifs (n = 15) is given in supplemental Figure 5. (B) Spatial distributions of motifs listed in A with respect to centers of H/M binding sites. (C) Comparison of normalized ChIP-chip signal of 6 TFs at H/M binding sites that are cooccupied by C/EBPα (red), PU.1 (blue), or both C/EBPα+PU.1 factors. In most cases (except HOXA9 and STAT5), H/M peaks that are cobound by C/EBPα showed highest expression intensity (red line), followed by C/EBPα+PU.1 (black line) and PU.1 (blue line). Similarly, the ChIP-chip signal at 60 randomly selected control regions is depicted by the gray line. (D) A large proportion of H/M peaks were found to overlap with enhancer sequences bound by C/EBPα (red), PU.1 (blue), or both C/EBPα+PU.1 (black) in lipopolysaccharide-stimulated macrophages. (E) Comparative motif enrichment analysis showed increased level enrichment of HOXA, PBX/MEIS1, and STAT motifs in the set of enhancers described by Heinz et al that are bound by Hoxa9 (green) and Meis1 (blue), but not in those that are not associated with Hoxa9 and Meis1 (red).
Figure 6
Figure 6
Examples of motifs enriched in Hoxa9-associated enhancers. Enriched motifs, each depicted as a colored rectangular box, are plotted for the central 200 bp of 8 representative Hoxa9-bound enhancers. These Hoxa9 enhancers are highly enriched for HOX, HOX-MEIS-PBX, CREB, MYB, CAUDAL, ETS, MYC, and STAT sites, among others. All motifs shown are significantly enriched in these Hoxa9 enhancers compared with random genome background (Motif Enrichment Analysis; supplemental Data). An enrichment statistic is computed with z-test comparing the observed frequencies (in H/M peaks) versus the expected frequencies (in random genomic background; P < .001). A complete compendium of motifs is provided in supplemental Data.
Figure 7
Figure 7
Hoxa9 association with enhanceosomes is associated with coactivator recruitment and histone acetylation. (A) Coimmunoprecipitations performed on Hoxa9/Meis1 transformed cells show that Meis1, Stat5, C/ebpα, and Creb1 immunoprecipitate with Hoxa9. Nuclease-treated extracts from BM cells stably transduced with either TAPTAG-Hoxa9/Meis1 (HM1) or HA-Hoxa9/FLAG-Meis1 (HM2) were immunoprecipitated (IP) with anti-HA Affinity Matrix (Roche Applied Science) or anti-FLAG M2 Agarose (Sigma-Aldrich). Proteins were separated by SDS-PAGE and detected by Western blot (WB) analysis. Meis1, Stat5, C/ebpα, and Creb1 coelute with Hoxa9, whereas Hoxa9, C/ebpα, and Creb1, but not Stat5, coimmunoprecipitate with Meis1. (B) Hoxa9 association is closely correlated with association of other enhanceosome components and histone acetylation at representative sites in Cd34, Flt3, and Dnajc10 loci. ChIP experiments were performed with anti-HA Meis1, C/ebpα, Stat5, P300, and histone H3 pan acetyl Abs on a HA epitope-tagged Hoxa9-ER/Meis1-transformed myeloblastic cell line (HM4) as described in “Experimental procedures.” Green bars represent the PCR signal as a percent of input for ChIP on cells cultured for 96 hours in the presence of 4-OHT, and yellow bars represent ratio for cells cultured for 96 hours in the absence of 4-OHT with the exception of C/ebpα, which was cultured for 168 hours. Two control regions not determined to be bound by ChIP-Seq are shown. Additional data are shown in supplemental Figure 6. (C) Model for Hoxa9 regulation of enhanceosome activity. Hoxa9 interacts with enhanceosomes containing as a result of homeodomain domain–DNA interactions, association with Meis1 (Pbx proteins are not shown but may further enhance binding) and direct or indirect interactions with C/ebpα, Creb1 and Stat5a/b. Binding of Hoxa9 promotes P300/CBP recruitment through the Meis1 C terminal domain and potentially other interactions with enhanceosome-associated TFs. A variety of oncogenic alterations, including MLL fusion proteins, CDX2 or CDX4 overexpression, NPMc or NUP98 fusion proteins enforce high level Hoxa9 expression, making enhanceosome coactivator activity refractory to physiologic differentiation signals. The resulting persistent expression of proliferative target genes such as Flt3, Sox4, Lmo2 and Myb leads to leukemic transformation.

References

    1. Argiropoulos B, Humphries RK. Hox genes in hematopoiesis and leukemogenesis. Oncogene. 2007;26(47):6766–6776. - PubMed
    1. Pineault N, Helgason CD, Lawrence HJ, Humphries RK. Differential expression of Hox, Meis1, and Pbx1 genes in primitive cells throughout murine hematopoietic ontogeny. Exp Hematol. 2002;30(1):49–57. - PubMed
    1. Thorsteinsdottir U, Mamo A, Kroon E, et al. Overexpression of the myeloid leukemia-associated Hoxa9 gene in bone marrow cells induces stem cell expansion. Blood. 2002;99(1):121–129. - PubMed
    1. Izon DJ, Rozenfeld S, Fong ST, Komuves L, Largman C, Lawrence HJ. Loss of function of the homeobox gene Hoxa-9 perturbs early T-cell development and induces apoptosis in primitive thymocytes. Blood. 1998;92(2):383–393. - PubMed
    1. Armstrong SA, Staunton JE, Silverman LB, et al. MLL translocations specify a distinct gene expression profile that distinguishes a unique leukemia. Nat Genet. 2002;30(1):41–47. - PubMed

Publication types

MeSH terms