

A peptidomimetic targeting white fat causes weight loss and improved insulin resistance in obese monkeys
- PMID: 22072637
- PMCID: PMC3666164
- DOI: 10.1126/scitranslmed.3002621
A peptidomimetic targeting white fat causes weight loss and improved insulin resistance in obese monkeys
Abstract
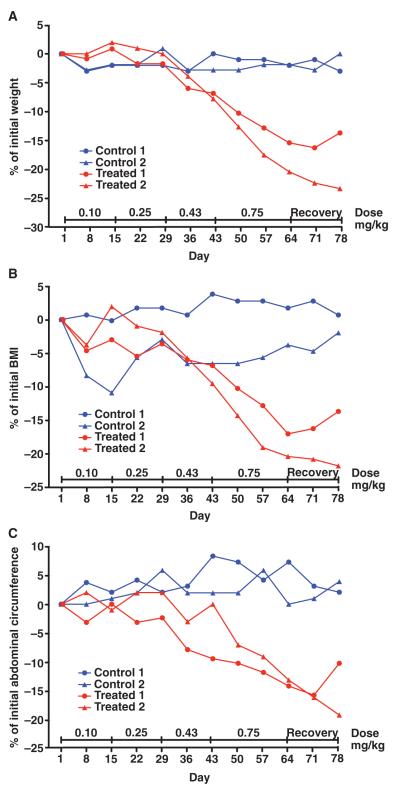
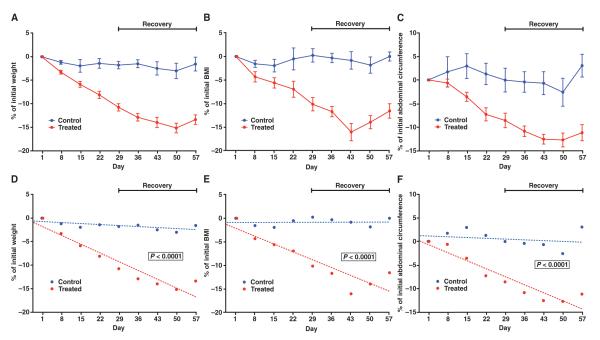
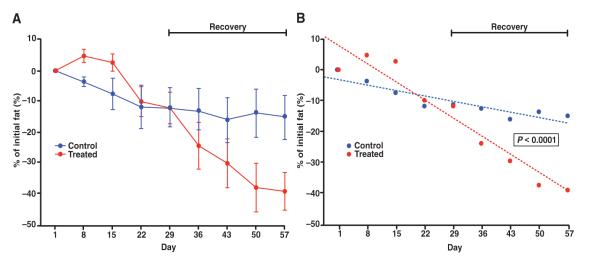
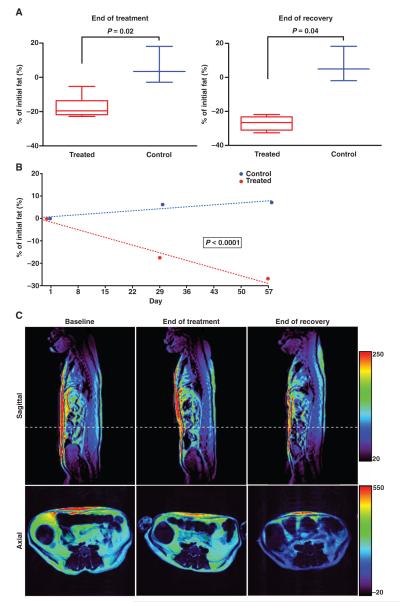
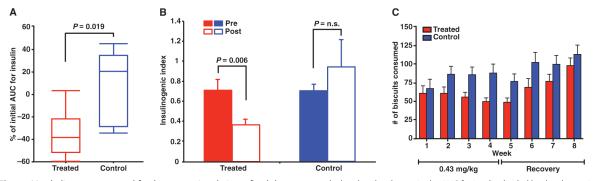
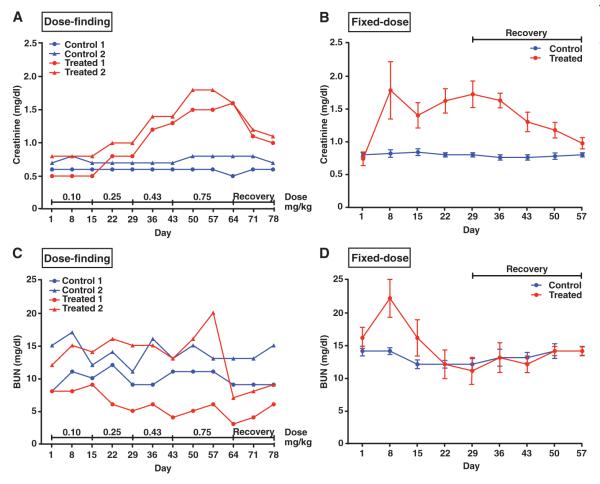
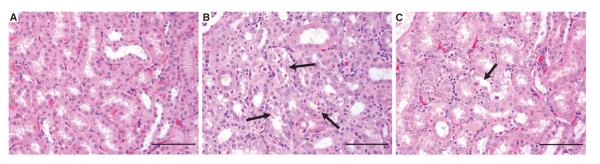
Obesity, defined as body mass index greater than 30, is a leading cause of morbidity and mortality and a financial burden worldwide. Despite significant efforts in the past decade, very few drugs have been successfully developed for the treatment of obese patients. Biological differences between rodents and primates are a major hurdle for translation of anti-obesity strategies either discovered or developed in rodents into effective human therapeutics. Here, we evaluate the ligand-directed peptidomimetic CKGGRAKDC-GG-(D)(KLAKLAK)(2) (henceforth termed adipotide) in obese Old World monkeys. Treatment with adipotide induced targeted apoptosis within blood vessels of white adipose tissue and resulted in rapid weight loss and improved insulin resistance in obese monkeys. Magnetic resonance imaging and dual-energy x-ray absorptiometry confirmed a marked reduction in white adipose tissue. At experimentally determined optimal doses, monkeys from three different species displayed predictable and reversible changes in renal proximal tubule function. Together, these data in primates establish adipotide as a prototype in a new class of candidate drugs that may be useful for treating obesity in humans.
Figures
Comment in
-
Comment on "a peptidomimetic targeting white fat causes weight loss and improved insulin resistance in obese monkeys".Sci Transl Med. 2012 Apr 25;4(131):131le2; author reply 131lr2. doi: 10.1126/scitranslmed.3003760. Sci Transl Med. 2012. PMID: 22539771
Similar articles
-
Comment on "a peptidomimetic targeting white fat causes weight loss and improved insulin resistance in obese monkeys".Sci Transl Med. 2012 Apr 25;4(131):131le2; author reply 131lr2. doi: 10.1126/scitranslmed.3003760. Sci Transl Med. 2012. PMID: 22539771
-
A comparative study between nanoparticle-targeted therapeutics and bioconjugates as obesity medication.J Control Release. 2013 Oct 28;171(2):104-12. doi: 10.1016/j.jconrel.2013.07.013. Epub 2013 Jul 18. J Control Release. 2013. PMID: 23871959
-
The effect of orlistat-induced weight loss, without concomitant hypocaloric diet, on cardiovascular risk factors and insulin sensitivity in young obese Chinese subjects with or without type 2 diabetes.Arch Intern Med. 2002 Nov 25;162(21):2428-35. doi: 10.1001/archinte.162.21.2428. Arch Intern Med. 2002. PMID: 12437401 Clinical Trial.
-
Adipose tissue morphology predicts improved insulin sensitivity following moderate or pronounced weight loss.Int J Obes (Lond). 2015 Jun;39(6):893-8. doi: 10.1038/ijo.2015.18. Epub 2015 Feb 10. Int J Obes (Lond). 2015. PMID: 25666530
-
Metabolic remodeling in adipocytes promotes ciliary neurotrophic factor-mediated fat loss in obesity.Endocrinology. 2008 May;149(5):2546-56. doi: 10.1210/en.2007-1447. Epub 2008 Feb 14. Endocrinology. 2008. PMID: 18276754
Cited by
-
Effective Design of Multifunctional Peptides by Combining Compatible Functions.PLoS Comput Biol. 2016 Apr 20;12(4):e1004786. doi: 10.1371/journal.pcbi.1004786. eCollection 2016 Apr. PLoS Comput Biol. 2016. PMID: 27096600 Free PMC article.
-
Importance of thorough tissue and cellular level characterization of targeted drugs in the evaluation of pharmacodynamic effects.PLoS One. 2019 Nov 14;14(11):e0224917. doi: 10.1371/journal.pone.0224917. eCollection 2019. PLoS One. 2019. PMID: 31725756 Free PMC article.
-
What we talk about when we talk about fat.Cell. 2014 Jan 16;156(1-2):20-44. doi: 10.1016/j.cell.2013.12.012. Cell. 2014. PMID: 24439368 Free PMC article. Review.
-
Prohibitin Inactivation in Adipocytes Results in Reduced Lipid Metabolism and Adaptive Thermogenesis Impairment.Diabetes. 2021 Oct;70(10):2204-2212. doi: 10.2337/db21-0094. Epub 2021 Jul 13. Diabetes. 2021. PMID: 34257070 Free PMC article.
-
In Silico Prediction of Anti-Infective and Cell-Penetrating Peptides from Thalassophryne nattereri Natterin Toxins.Pharmaceuticals (Basel). 2022 Sep 13;15(9):1141. doi: 10.3390/ph15091141. Pharmaceuticals (Basel). 2022. PMID: 36145362 Free PMC article.
References
-
- Withrow D, Alter DA. The economic burden of obesity worldwide: A systematic review of the direct costs of obesity. Obes. Rev. 2011;12:131–141. - PubMed
-
- Ludwig DS, Pollack HA. Obesity and the economy: From crisis to opportunity. JAMA. 2009;301:533–535. - PubMed
-
- Ledford H. Slim spoils for obesity drugs. Nature. 2010;468:878. - PubMed
-
- Eckel RH. Clinical practice. Nonsurgical management of obesity in adults. N. Engl. J. Med. 2008;358:1941–1950. - PubMed
Publication types
MeSH terms
Substances
Grants and funding
LinkOut - more resources
Full Text Sources
Other Literature Sources
Medical
Miscellaneous
