. 2011 Nov 9;31(45):16142-56.
doi: 10.1523/JNEUROSCI.2520-11.2011.

Dendritic spine dynamics regulate the long-term stability of synaptic plasticity

Affiliations

Dendritic spine dynamics regulate the long-term stability of synaptic plasticity

Cian O'Donnell et al. J Neurosci. .

Abstract

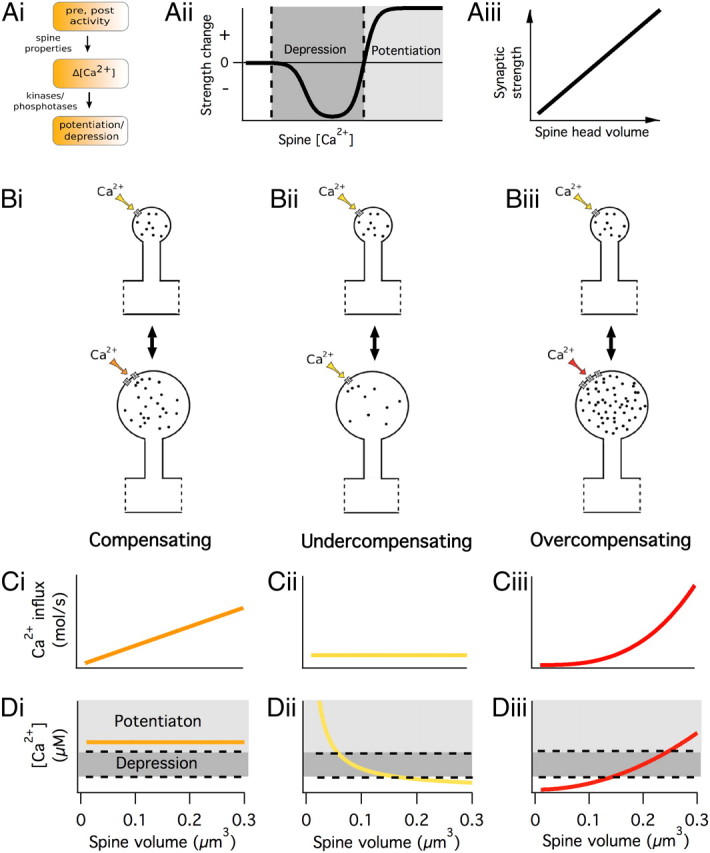
Long-term synaptic plasticity requires postsynaptic influx of Ca²⁺ and is accompanied by changes in dendritic spine size. Unless Ca²⁺ influx mechanisms and spine volume scale proportionally, changes in spine size will modify spine Ca²⁺ concentrations during subsequent synaptic activation. We show that the relationship between Ca²⁺ influx and spine volume is a fundamental determinant of synaptic stability. If Ca²⁺ influx is undercompensated for increases in spine size, then strong synapses are stabilized and synaptic strength distributions have a single peak. In contrast, overcompensation of Ca²⁺ influx leads to binary, persistent synaptic strengths with double-peaked distributions. Biophysical simulations predict that CA1 pyramidal neuron spines are undercompensating. This unifies experimental findings that weak synapses are more plastic than strong synapses, that synaptic strengths are unimodally distributed, and that potentiation saturates for a given stimulus strength. We conclude that structural plasticity provides a simple, local, and general mechanism that allows dendritic spines to foster both rapid memory formation and persistent memory storage.


Figures

Figure 1.
Figure 1.
The relationship between spine size and Ca2+ influx falls into one of three different scenarios. Ai, The synaptic plasticity cascade. Coincident presynaptic and postsynaptic activity triggers postsynaptic Ca2+ signals, which are shaped by dendritic spine properties. Ca2+ signals trigger kinase- and phosphatase-based molecular cascades, resulting in long-term potentiation/depression. Aii, Ca2+-dependent synaptic plasticity rule. The change in synaptic strength as a function of spine [Ca2+]. There is a moderate threshold for depression and a higher threshold for potentiation. Aiii, Spine size is assumed to be proportional to synaptic strength, in accordance with experimental data (Matsuzaki et al., 2001). Bi, Ca2+ influx might exactly compensate for changes in spine volume so that [Ca2+] is independent of spine size. Bii, Ca2+ influx might undercompensate for changes in spine volume so that large spines have lower amplitude [Ca2+] transients than small spines. Biii, Ca2+ influx might overcompensate for changes in spine volume so that large spines have higher-amplitude [Ca2+] transients than small spines. C, D, The absolute amount of Ca2+ influx (C) and Ca2+ concentration change (D) following a plasticity-inducing stimulus, as a function of spine volume. Ci, In the compensating scenario, Ca2+ influx is proportional to spine volume. Di, This leads to a volume-independent [Ca2+]. Hence, a given stimulus causes the same synaptic plasticity for spines of all sizes. Cii, In the undercompensating scenario, Ca2+ influx is sublinear with spine volume. Dii, This leads to large spines experiencing lower [Ca2+] than small spines. Hence, a given stimulus can cause potentiation at small spines, depression at medium-sized spines, and no change in synaptic strength at large spines. Ciii, In the overcompensating scenario, Ca2+ influx is superlinear with spine volume. Diii, This leads to large spines experiencing higher [Ca2+] than small spines. Hence, a given stimulus can cause potentiation at large spines, depression at medium-sized spines, and no synaptic strength change at small spines.
Figure 2.
Figure 2.
The effect of stimulus intensity on the direction of synaptic plasticity for the three different scenarios. A, Increasing the stimulus intensity (from thinner to thicker lines) increases the Ca2+ influx across all synaptic strengths in all three cases. Ai, For the compensating rule, the direction of synaptic plasticity is dependent on stimulus intensity, but not on synaptic strength. Aii, For the undercompensating rule, each stimulus intensity leads to a corresponding stable strength (intersection of orange curves with upper dashed line). Above the stable strength, synapses are depressed, while below the stable strength, synapses are potentiated. Stronger stimuli shift the stable point to greater synaptic strengths. Aiii, For the overcompensating rule, each stimulus intensity has a corresponding unstable threshold strength (intersection of red curves with the upper dashed line). Above the threshold synapses are potentiated, while below the threshold synapses are depressed. Stronger stimuli shift the unstable threshold to weaker strengths. B, Plasticity direction as a function of both stimulus strength (horizontal axis) and spine volume (vertical axis). Dashed black curves indicate thresholds for LTD and LTP. Arrows indicate the direction of change of synaptic strength. C, Final synaptic strengths on an integrate-and-fire neuron following prolonged Poisson stimulation, as a function of presynaptic firing rate. Ci, Compensation results in synapses eventually drifting to their maximum or minimum strength, depending on their stimulation rate. Cii, Undercompensation yields synapses that represent the stimulation rate as a continuous variable. Ciii, Overcompensation leads to either maximal or minimal strengths, but whether a synapse ends up strong or weak depends not only on the stimulus rate, but also on the initial synaptic strength. Above the separatrix (dashed gray curve), the synapse will potentiate, but below it will depress. Depr., Depression; Pot., potentiation.
Figure 3.
Figure 3.
Memory induction and retention in an integrate-and-fire neuron depend on the relationship between spine size and Ca2+ influx. Ai, Aii, Synapses potentiate in response to a strong stimulus (vertical arrows) and then drift over time due to weak ongoing activity that occasionally triggers plasticity. Ai–Aiii, Dark and light colors indicate synapses subject to 3× and 1× burst stimuli, respectively, for the compensating (Ai), undercompensating (Aii), and overcompensating (Aiii) scenarios. B, The drift of synaptic strength as a function of synaptic strength. Bi, In the compensating scenario, drift rate is independent of synaptic strength. Bii, In the undercompensating scenario, drift is large and negative for weak synapses, but small and negative for strong synapses. Biii, In the overcompensating scenario, drift is large and negative for weak synapses and large and positive for strong synapses.
Figure 4.
Figure 4.
The lifetime of undercompensating and overcompensating synapses in the presence of intrinsic fluctuations is substantially longer than for compensating synapses in a Fokker–Planck model. Ai–Aiii, Synaptic strength probability distributions over time for the compensating (Ai), undercompensating (Aii), and overcompensating (Aiii) scenarios. Darker color indicates higher probability. A synaptic plasticity event is simulated by initializing the synapse at a particular strength. The strength of the synapse then drifts probabilistically over time toward the steady-state strength. Note different time scales on the x-axis of each panel. Bi–Biii, Decay of median synaptic strength for the three learning rules for a range of different initial strength synapses. Ci, Cii, The synaptic retention time for the compensating (Ci) and undercompensating (Cii) learning rules as a function of initial synaptic strength. Undercompensation leads to very stable large spines, but their retention time is ultimately limited by intrinsic fluctuations. Di, Dii, Synaptic retention time for compensating (Di) and undercompensating (Dii) synapses of increasing initial strength (thin to thick lines) as a function of relative amplitude of fluctuations. Note differences in the time-scale axis between Di and Dii. E, Probability of overcompensating synapse spontaneously transitioning from lower to upper stable strength as a function of relative fluctuation amplitude.
Figure 5.
Figure 5.
Undercompensating synapses reproduce unimodal experimental synaptic strength distributions. The steady-state synaptic strength distributions predicted by the compensating (left), undercompensating (middle), and overcompensating (right) learning rules using a Fokker–Planck model. Only the undercompensating rule reproduces the central, unimodal synaptic strength distributions reported experimentally.
Figure 6.
Figure 6.
A biophysical spine model predicts that CA1 pyramidal synapses undercompensate. A, The spine model includes electrical dynamics (left) and Ca2+ dynamics (right). B, The spine's GluA and GluN conductances as a function of spine head volume. Colored symbols indicate spine volumes chosen for simulations presented in D–F. C, The peak spine head Ca2+ concentration obtained during burst stimulation is plotted as a function of spine head volume. Postsynaptic holding potentials of −30 and −50 mV are in light and dark green, respectively. D, E, GluA conductance of three synapses of different initial strength following a tetanic stimulus for postsynaptic potentials of −50 mV (D) and −30 mV (E). The small, medium, and large synapses had initial spine head volumes of 0.01, 0.05, and 0.15 μm3, respectively. F, Final synaptic strength (GluA conductance) for the small, medium, and large synapses following a tetanic plasticity-inducing stimulus for a range of postsynaptic potentials. G, Relative change in synaptic strength for same data as F.
Figure 7.
Figure 7.
Spine size influences Ca2+ nanodomain signaling in a molecular model of a CA1 pyramidal neuron dendritic spine. A, Schematic diagram of molecular spine model (MCell simulator). Shown are Ca2+ ions, calbindin, calmodulin, and a fast immobile endogenous buffer. L-type Ca2+ channel at top of spine, Ca2+ transparent patch (gray mesh) at bottom allowing Ca2+ escape to spine neck and dendrite. Not shown are 20 GluNs (distributed randomly across top surface of spine), PCMA Ca2+ pumps, NCXs, and leak Ca2+ influx channels (distributed randomly across entire surface of spine). B, State of the L-type Ca2+ channel (open or closed) as a function of time for 10 different trials. Note that the channel open and closes stochastically. C, Mean Ca2+ concentration throughout the spine as a function of time for the same 10 trials depicted in B. When the L-type Ca2+ channel opens, [Ca2+] is rapidly elevated. D, Local Ca2+ concentration as a function of distance from an open L-type Ca2+ channel. Each curve represents a different spine volume. Error bars are ±SD. E, Local Ca2+ concentration as a function of spine volume at various distances from an open L-type Ca2+ channel. Same data as in D. Bulk, indicates mean Ca2+ concentration over the entire spine volume. Error bars are ±SD.

Similar articles

Cited by

References

    1. Arellano JI, Benavides-Piccione R, Defelipe J, Yuste R. Ultrastructure of dendritic spines: correlation between synaptic and spine morphologies. Front Neurosci. 2007;1:131–143. - PMC - PubMed
    1. Artola A, Bröcher S, Singer W. Different voltage-dependent thresholds for inducing long-term depression and long-term potentiation in slices of rat visual cortex. Nature. 1990;347:69–72. - PubMed
    1. Augustine GJ, Santamaria F, Tanaka K. Local calcium signaling in neurons. Neuron. 2003;40:331–346. - PubMed
    1. Barbour B, Brunel N, Hakim V, Nadal JP. What can we learn from synaptic weight distributions? Trends Neurosci. 2007;30:622–629. - PubMed
    1. Barrett AB, van Rossum MC. Optimal learning rules for discrete synapses. PLoS Comput Biol. 2008;4:e1000230. - PMC - PubMed

Publication types

LinkOut - more resources