. 2011 Nov 9;31(45):16194-207.
doi: 10.1523/JNEUROSCI.5877-10.2011.

Deletion of densin-180 results in abnormal behaviors associated with mental illness and reduces mGluR5 and DISC1 in the postsynaptic density fraction

Affiliations

Deletion of densin-180 results in abnormal behaviors associated with mental illness and reduces mGluR5 and DISC1 in the postsynaptic density fraction

Holly J Carlisle et al. J Neurosci. .

Abstract

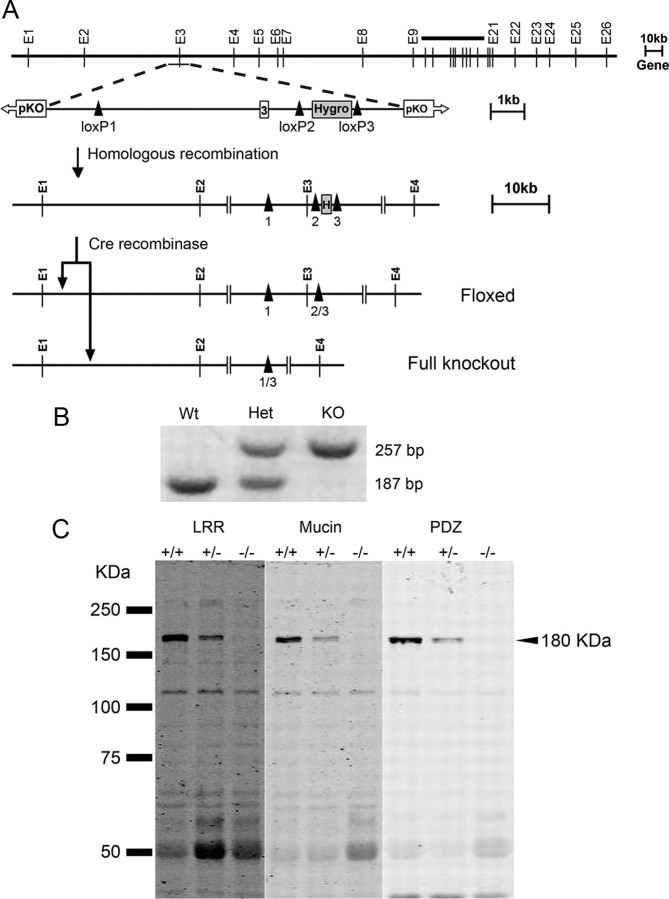
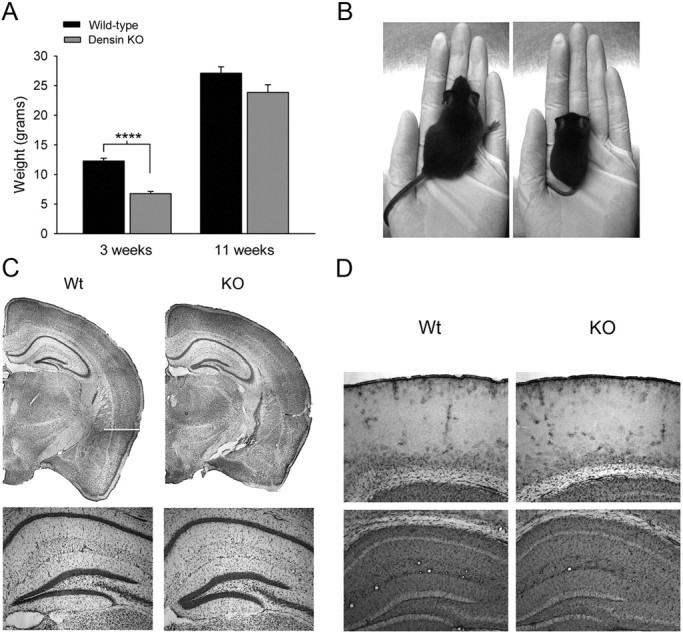
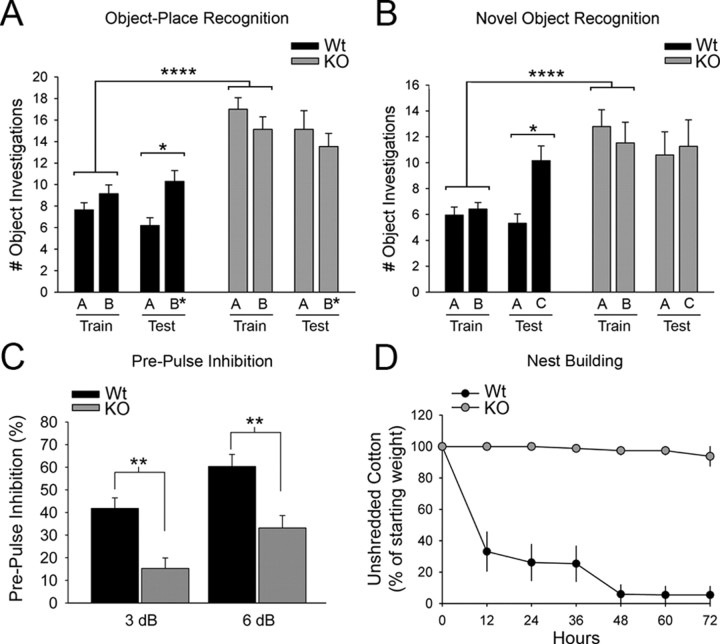
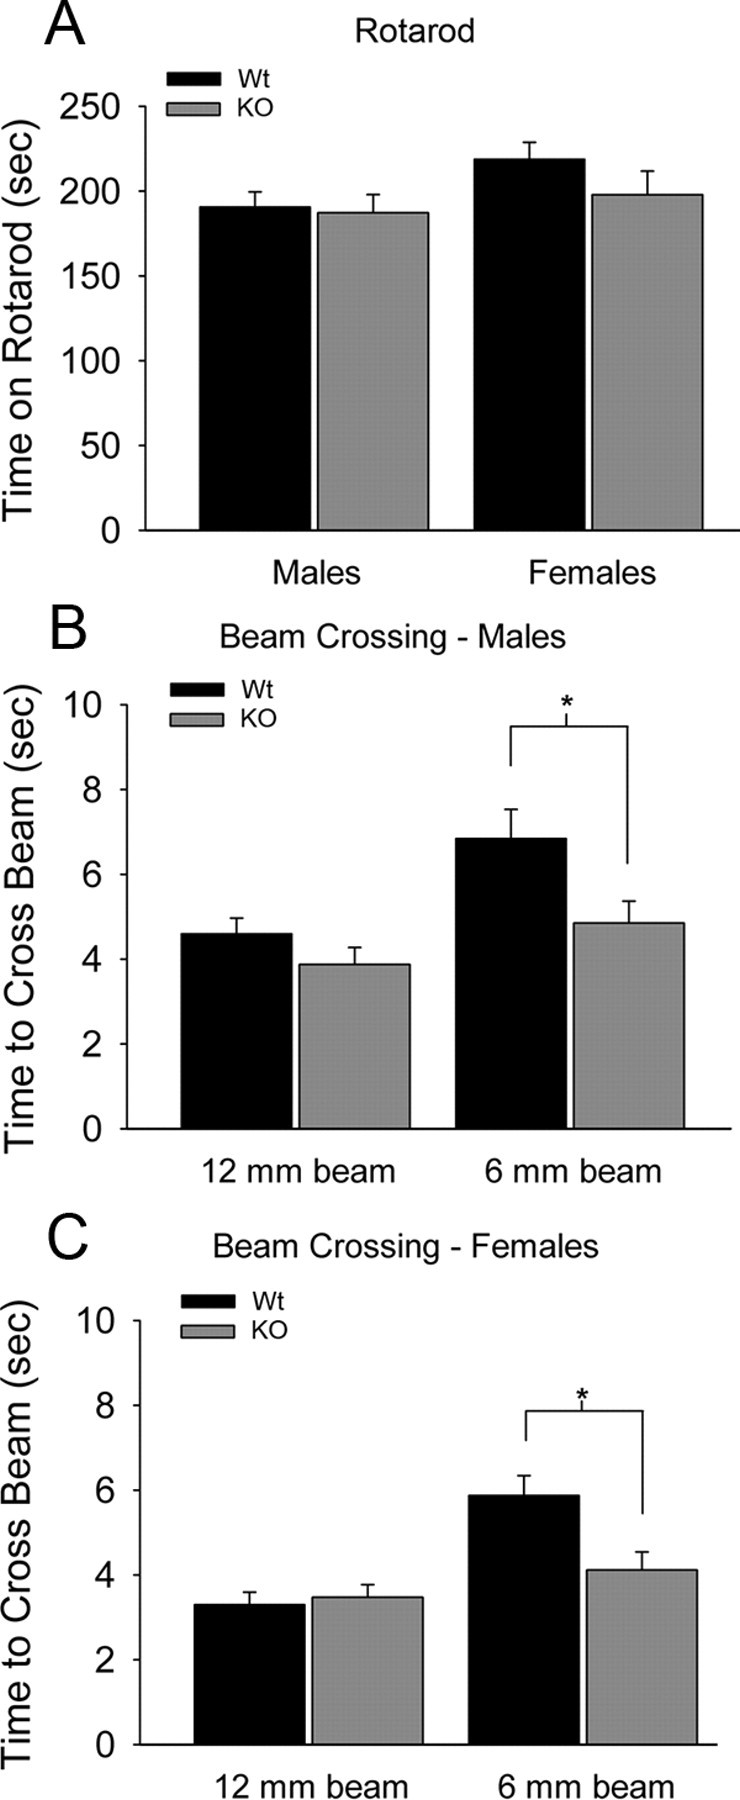
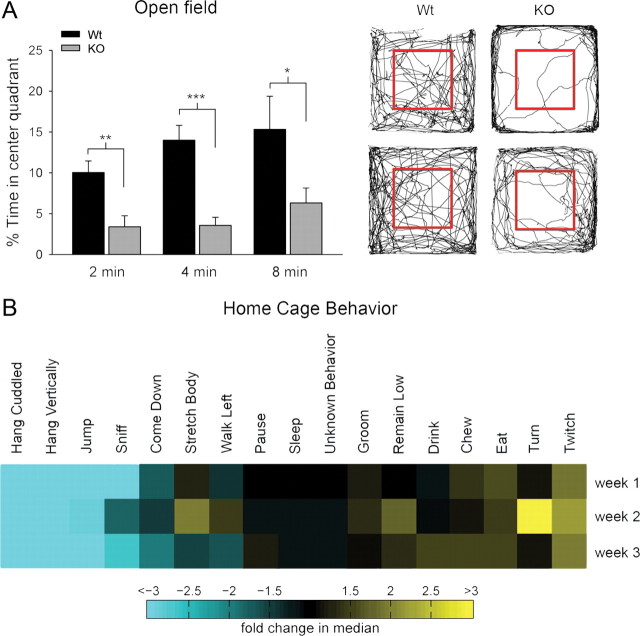
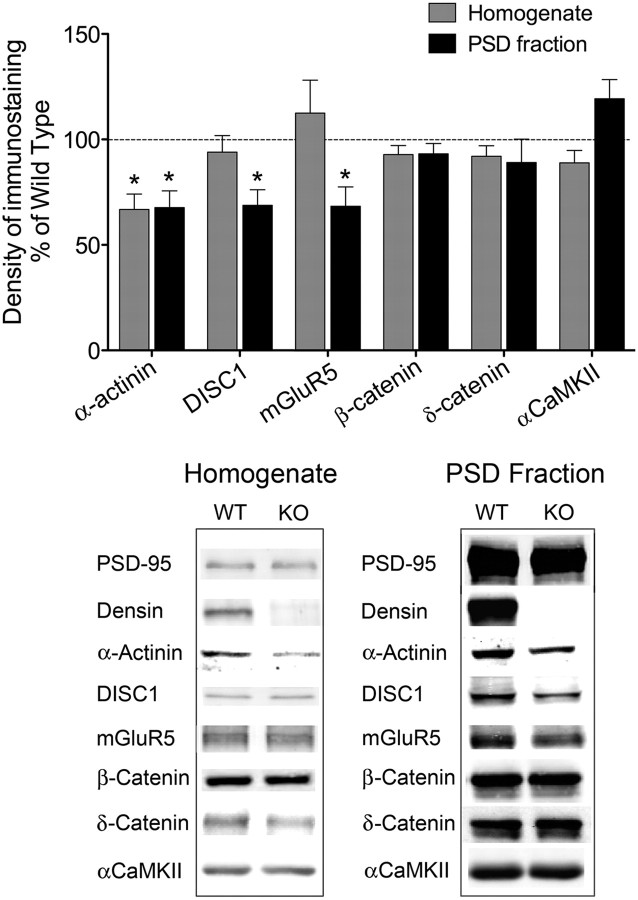
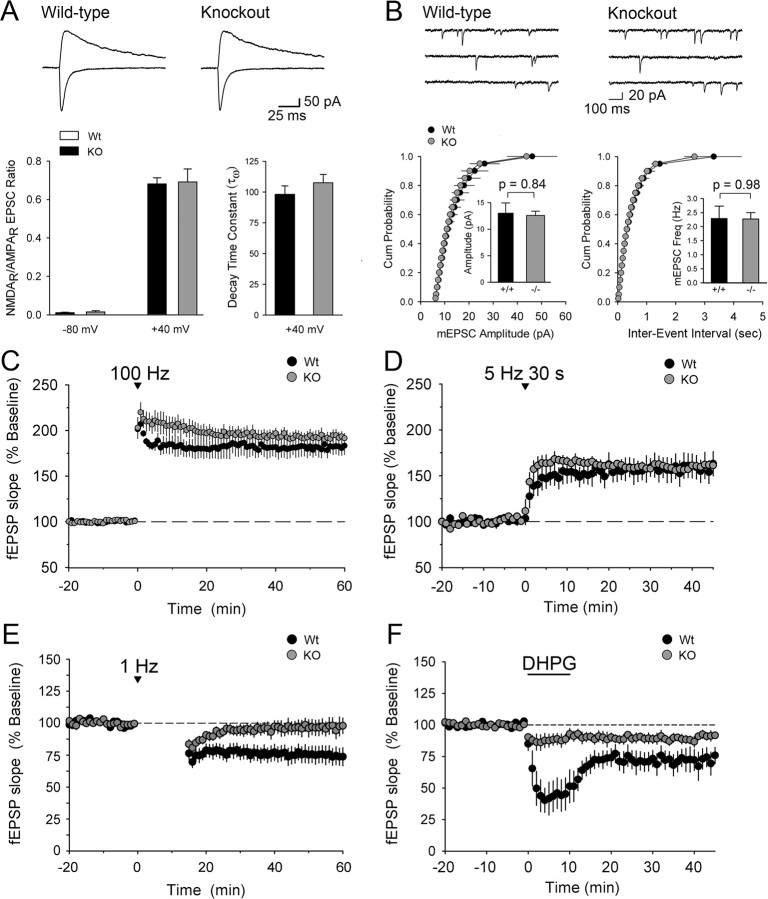
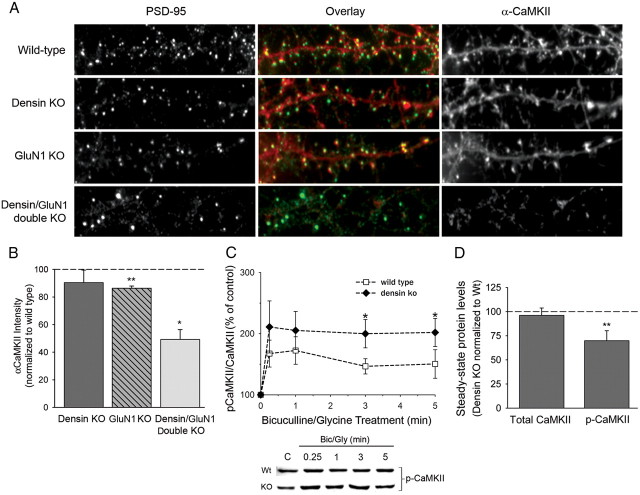
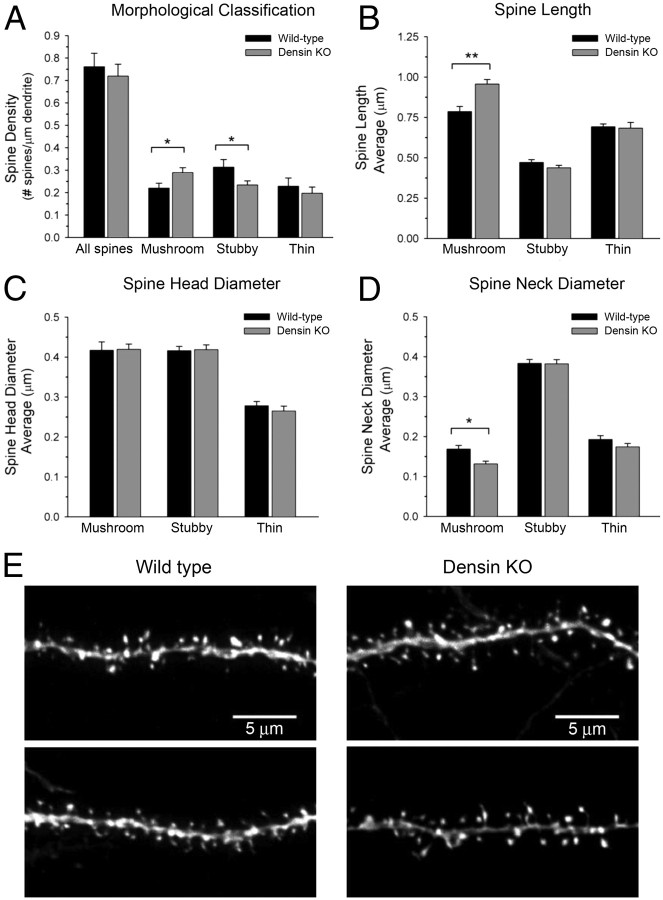
Densin is an abundant scaffold protein in the postsynaptic density (PSD) that forms a high-affinity complex with αCaMKII and α-actinin. To assess the function of densin, we created a mouse line with a null mutation in the gene encoding it (LRRC7). Homozygous knock-out mice display a wide variety of abnormal behaviors that are often considered endophenotypes of schizophrenia and autism spectrum disorders. At the cellular level, loss of densin results in reduced levels of α-actinin in the brain and selective reduction in the localization of mGluR5 and DISC1 in the PSD fraction, whereas the amounts of ionotropic glutamate receptors and other prominent PSD proteins are unchanged. In addition, deletion of densin results in impairment of mGluR- and NMDA receptor-dependent forms of long-term depression, alters the early dynamics of regulation of CaMKII by NMDA-type glutamate receptors, and produces a change in spine morphology. These results indicate that densin influences the function of mGluRs and CaMKII at synapses and contributes to localization of mGluR5 and DISC1 in the PSD fraction. They are consistent with the hypothesis that mutations that disrupt the organization and/or dynamics of postsynaptic signaling complexes in excitatory synapses can cause behavioral endophenotypes of mental illness.


Figures

Figure 1.
Figure 1.
Disruption of the LRRC7 gene encoding densin. A, Targeting vector and recombined floxed alleles. The targeting construct for exon 3 included a LoxP site inserted into intron 2 and a hygromycin selection cassette flanked by LoxP sites inserted into intron 3 (LoxP sites indicated by black arrowheads). Expression of Cre recombinase in utero resulted in the deletion of the hygromycin selection cassette, producing a floxed exon 3 conditional knock-out, or in the deletion of both exon 3 and the hygromycin cassette, producing a full knock-out. B, Southern blot analysis of PCR products from DNA of wild-type (Wt), heterozygous (Het), and knock-out (KO) littermates. C, Immunoblot analysis of expression of densin protein in forebrain homogenates of 6-week-old mice. Aliquots containing equal amounts of total protein were fractionated and blotted as described in Materials and Methods with antibodies raised against three distinct regions of densin: N-terminal LRR domain, mucin homology domain, and C-terminal PDZ domain.
Figure 2.
Figure 2.
Densin knock-out mice have normal gross neuroanatomy and low body weight. A, At 3 weeks of age, densin knock-out mice had significantly lower body weights (6.8 ± 0.4 g, n = 15 mice) than wild-type mice (12.3 ± 0.5 g; n = 17 mice; ****p < 0.0001). By 11 weeks of age, the disparity in their weights was much less dramatic (wild-type, 27.1 ± 1.1 g, n = 21; densin knock-out, 23.9 ± 1.3 g; n = 19; p = 0.062). Significance was determined with two-tailed t test. Error bars represent SEM. B, Representative pictures of wild-type (left) and densin knock-out littermates (right) at 3 weeks of age. C, Representative Nissl-stained coronal sections from wild-type (left) and densin knock-out (right) mice (bregma −1.7 mm). Bottom row shows 5× images of the dentate gyrus. D, Immunohistochemical staining for GFAP is qualitatively similar in wild-type (left column) and knock-out (right column) sections. Representative images are shown of sensory cortex (top row) and the CA1 region of hippocampus (bottom row). Heterozygous, Het; Wt, wild type.
Figure 3.
Figure 3.
Short-term memory, sensorimotor gating, and nest building are impaired in densin knock-out mice. A, Knock-out (KO) mice did not show increased preference for the moved object (B*) in a place preference test designed to measure hippocampus-dependent short-term spatial memory (stationary object, 15.1 ± 1.7 investigations; moved object, 13.5 ± 1.2 investigations; n = 15 mice), whereas wild-type (Wt) mice did prefer the moved object as measured by a significant increase in the number of investigations of the moved object (stationary object, 6.2 ± 0.7 investigations; moved object, 10.3 ± 1.0 investigations; n = 20 mice; *p < 0.05). Despite not showing a preference for the moved object during the testing session, densin knock-out mice investigated objects A and B more frequently on average than the wild-type mice during the training session (wild type, 8.4 ± 0.5 investigations, n = 40 trials; knock-out, 16.1 ± 0.8 investigations, n = 30 trials; ****p < 0.0001). B, Densin knock-out mice were similarly unable to discriminate between a novel object (C) and a previously viewed object in a hippocampus-independent novel object recognition task (previously viewed, 10.6 ± 1.8 investigations; novel, 11.3 ± 2.0 investigations), whereas the wild-type mice showed an increase in the number of investigations of the novel object (previously viewed, 5.3 ± 0.7 investigations; novel, 10.2 ± 1.1 investigations; n = 15 mice). Knock-out mice again showed an increased average number of investigations of objects A and B during the training session compared with wild-type mice (wild type, 6.2 ± 0.5 investigations, n = 40 trials; knock-out, 12.2 ± 1.0 investigations, n = 30 trials; p < 0.0001). C, Knock-out mice have abnormal sensorimotor gating. Startle induced by a 120 dB pulse of sound was significantly less inhibited by a prepulse (3 or 6 dB) in the knock-out (3 dB, 15 ± 5% PPI; 6 dB, 33 ± 5% PPI; n = 13 knock-out mice) compared with wild-type mice (3 dB, 42 ± 5% PPI; 6 dB, 60 ± 5% PPI; n = 12 wild types; **p < 0.01, ANOVA). D, Knock-out mice show impaired nest building. Wild-type mice shredded ∼60% of the supplied cotton within 12 h and all had fully formed nests within 48 h (black dots, n = 13 wild types). Only one of the knock-out mice removed and shredded the cotton; all others left the cotton unshredded (gray dots, n = 16 knock-out mice). Wild-type mice had significantly less unshredded cotton in their cages at all measured time points after t = 0 (p < 0.001, Mann–Whitney U test). Error bars represent SEM.
Figure 4.
Figure 4.
Densin knock-out mice have normal motor skills. A, Male and female knock-out (KO) mice performed as well as the wild types (Wt) on the rotarod test. Male wild-type mice stayed on the accelerating rotarod for 191 ± 9 s (n = 20 mice), whereas male knock-out mice stayed on for 187 ± 11 s (n = 15 mice). Female wild-type mice stayed on the accelerating rotarod for 219 ± 10 s (n = 11 mice), whereas female knock-out mice stayed on for 198 ± 14 s (n = 9 mice). B, Male knock-out mice crossed the 12 mm beam as fast as wild types (male wild types, 4.6 ± 0.4 s; male knock-outs, 3.9 ± 0.4 s) and crossed the 6 mm beam significantly faster than wild types (male wild types, 6.8 ± 0.7 s; male knock-outs, 4.9 ± 0.5 s; *p < 0.05, two-tailed t test). C, Similarly, female knock-out mice crossed the 12 mm beam as fast as wild types (female wild types, 3.3 ± 0.3 s; female knock-outs, 3.5 ± 0.3 s) and crossed the 6 mm beam significantly faster than wild types (female wild types, 5.9 ± 0.6 s; female knock-outs, 4.1 ± 0.4 s; *p < 0.05, two-tailed t test).
Figure 5.
Figure 5.
Densin knock-out mice have increased levels of anxiety and reduced home-cage activity and are aggressive with littermates. A, Knock-out (KO) mice displayed anxiety-like behaviors in an open field. The percentage of time knock-out mice spent in the center quadrant of the open field was significantly less than wild types (Wt) during the first 2 min (wild type, 10.0 ± 1.4%; knock-out, 3.4 ± 1.3%; n = 20 wild-type mice, 15 knock-out mice; **p < 0.01), 4 min (wild type, 14.0 ± 1.8%; knock-out, 3.6 ± 1.0%; n = 17 wild-type mice, 10 knock-out mice; ***p < 0.001), and 8 min (wild type, 15.3 ± 4.0%; knock-out, 6.3 ± 1.8%; n = 8 wild-type mice, 7 knock-out mice; *p < 0.05, two-tailed t test; error bars represent SEM) of exploration in the open field. Right shows representative paths traveled by wild-type (left) and knock-out (right) mice during 10 min of exploration in an open field. The inner gray box marks the boundaries of the center quadrant. B, Densin knock-out mice are hypoactive in a home-cage setting. The heat plot shows behaviors detected by an automated home-cage monitoring system over a 24 h period at 8, 10, and 12 weeks of age (weeks 1, 2, and 3, respectively). Behaviors are expressed as the fraction of frames that the behavior was detected and normalized to wild-type values. Light blue represents behaviors for which there was a >2.5-fold decrease compared with wild-type. Bright yellow represents behaviors for which there was a >2.5-fold increase compared with wild-type. Knock-out mice spent significantly less time engaged in high-activity behaviors, such as hanging, jumping, and rearing.
Figure 6.
Figure 6.
Levels of α-actinin, DISC1, and mGluR5 are reduced in PSD fractions from densin knock-out mice. Protein levels in brain homogenates and PSD fractions from several sets of mice, each containing seven to eight pooled wild-type (WT) brains and seven to eight pooled densin knock-out (KO) brains, were determined by immunoblot. Average levels in fractions from knock-outs were normalized to those of corresponding wild types. The densin-binding protein α-actinin was reduced by 33% in brain homogenates and 32% in PSD fractions from knock-out mice compared with wild type (n = 4 subcellular fractionations). The α-actinin-binding partners DISC1 and mGluR5 were reduced by ∼30% in PSD fractions from knock-out mice but were not reduced in brain homogenates (n = 3 subcellular fractionations for DISC1; n = 5 brain homogenates and 3 PSD preparations for mGluR5). Loss of densin did not alter the levels of other known densin-interacting proteins: β-catenin, δ-catenin, or α-CaMKII. Statistical significance was determined with one-sample t tests (null hypothetical mean = 100). Error bars represent SEM. The amounts of actin or of PSD-95 (as appropriate) were quantified and used as loading controls. Bottom panels show representative bands from immunoblots of homogenates and PSD fractions. *p < 0.05.
Figure 7.
Figure 7.
Evoked NMDAR currents, mEPSCs, and LTP amplitude are normal in knock-out hippocampal slices, but LTD is impaired. A, Loss of densin does not alter the ratio of NMDA/AMPA receptor currents. Top traces show representative whole-cell voltage-clamp recordings of EPSCs from wild-type (Wt) and knock-out (KO) CA1 pyramidal neurons at two different postsynaptic membrane potentials (−80 and +40 mV). The left graph shows the NMDAR-mediated EPSCs (estimated from the EPSC amplitude 50 ms after EPSC onset) normalized to the AMPA receptor-mediated component of the EPSC (estimated from the EPSC amplitude 5 ms after EPSC onset). There is no difference in EPSCs between wild-type cells (black bars; n = 3 wild-type mice, 13 cells) and knock-out cells (gray bars; n = 3 knock-out mice, 14 cells) at either membrane potential. The right graph shows the comparison of weighted mean decay time constants of NMDAR-mediated EPSCs calculated from double-exponential fits to the decay of the synaptic currents recorded at +40 mV. No difference in the decay characteristics was observed between wild-type and knock-out mice. B, Loss of densin does not affect the amplitude or frequency of mEPSCs. Top traces show representative whole-cell voltage-clamp recordings from CA1 pyramidal neurons. Cumulative amplitude (left graph) and interevent interval (right graph) distributions were similar for both genotypes (n = 3 wild-type mice, 13 cells; n = 3 knock-out mice, 13 cells). Inset graphs show averages of mEPSC amplitudes and interevent intervals. C, D, High-frequency and theta-induced forms of LTP in the CA1 region of the hippocampus are normal in knock-out mice. C, Similar levels of fEPSP potentiation were recorded 60 min after 100 Hz stimulation (2 trains, each of 1 s duration, delivered at time = 0) for both genotypes (wild-type fEPSPs were 182 ± 8% of baseline, n = 4; densin knock-out fEPSPs were 193 ± 6% of baseline, n = 4). D, The 5 Hz stimulation for 30 s (delivered at t = 0) potentiated fEPSPs to similar levels in both genotypes (wild-type fEPSPs were 159 ± 13% of baseline, n = 4 wild-type mice; knock-out fEPSPs were 161 ± 4% of baseline 45 min after 5 Hz stimulation, n = 5 knock-out mice). The trend in C and D toward smaller fEPSPs in the wild type at 5–10 min after stimuli was not statistically significant. E, Low frequency-induced LTD is impaired in knock-out hippocampal slices. Wild-type fEPSPs were depressed to 74 ± 7% of baseline (n = 7 wild-type mice) 60 min after the start of a 15 min train of 1 Hz stimulation, whereas knock-out fEPSPs returned to baseline levels (98 ± 6% of baseline, n = 8 knock-out mice). There was a significant difference in the amplitudes of the fEPSPs between the two genotypes at t = 60 (p < 0.05, two-tailed t test). F, The group 1 mGluR agonist DHPG induced a lower level of fEPSP depression in knock-out compared with wild-type slices. Bath application of DHPG depressed wild-type fEPSPs to 49 ± 12% of baseline, whereas knock-out fEPSPs were only reduced to 87 ± 5.2% of baseline during the first 5 min of drug application (p = 0.016, two-tailed t test; n = 6 wild-type, 6 knock-out mice). At 35 min after washout of DHPG (t = 45), wild-type fEPSPs were reduced to 78 ± 6.4% of baseline and knock-out fEPSPs were reduced to 92 ± 2.2% of baseline (p = 0.031, one-tailed t test). Error bars represent SEM.
Figure 8.
Figure 8.
Densin is not required for localization of CaMKII in spines, but loss of densin alters activity-dependent autophosphorylation of CaMKII. A, Representative images of hippocampal neurons cultured from wild-type, densin knock-out, GluN1 knock-out, and densin/GluN1 double knock-out mice, immunostained for αCaMKII (green) and PSD-95 (red). B, Loss of either densin or NMDARs (two postulated high-affinity CaMKII binding sites in the PSD) resulted in only small reductions in the intensity of CaMKII immunostaining that colocalized with PSD-95, whereas loss of both proteins resulted in a ∼50% reduction in the intensity of CaMKII immunostaining colocalizing with PSD-95. The graph shows the intensity of staining for CaMKII colocalized with PSD-95 puncta in densin knock-out, GluN1 knock-out, and densin/GluN1 double knock-out cultures normalized to wild-type levels (densin knock-out, 90.4 ± 9.1% of wild type, n = 4 densin knock-out embryos; GluN1 knock-out, 86.3 ± 1.6% of wild type, n = 4 GluN1 knock-out embryos, **p < 0.01; densin/GluN1 knock-out, 49.2 ± 7.2% of wild type, n = 3 densin/GluN1 double knock-out embryos, *p < 0.05, one-sample t test). C, Autophosphorylation of CaMKII (Thr286) in response to synaptic activity is increased in densin knock-out (KO) compared with wild-type (Wt) cultures. Top shows representative immunoblots of homogenates of hippocampal cultures that were treated with bicuculline (10 μm)/glycine (10 μm) for 0.25, 1, 3, or 5 min. Homogenates were fractionated by SDS-PAGE and stained with anti-phospho-CaMKII antibody (C, untreated control) as described under Materials and Methods. The graph shows the average intensity of phospho-CaMKII immunostaining (normalized to total CaMKII) after treatment with bicuculline/glycine, expressed as a percentage of the untreated control. The increase in phospho-CaMKII over untreated control levels is significantly greater in densin knock-out cultures compared with wild-type after treatment with bicuculline/glycine for 3 min (wild type, 147 ± 12%; densin knock-out, 200 ± 23% of control; *p < 0.05, ANOVA) and 5 min (wild type, 150 ± 23%; densin knock-out, 202 ± 23% of control; *p < 0.05, ANOVA; n = 9 wild-type and 9 densin knock-out embryos). Error bars represent SEM. D, Steady-state autophosphorylation of CaMKII is reduced in densin knock-out compared with wild-type hippocampal neurons. There was no difference in the amount of total CaMKII in wild-type and knock-out neurons (knock-out, 96 ± 7.67% of wild type, n = 9 littermate pairs). However, a significantly smaller fraction of CaMKII was phosphorylated on the threonine-286 residue of CaMKII in the knock-out compared with wild-type neurons (knock-out, 74 ± 6.3% of wild type, n = 9 littermate pairs, **p < 0.01, one-sample t test; hypothetical mean = 100).
Figure 9.
Figure 9.
Hippocampal dendritic spines from adult densin knock-out (KO) mice are elongated compared with spines from wild-type mice. A, Knock-out of densin resulted in a 31% increase in the number of mushroom spines (wild type, 0.22 ± 0.02; knock-out, 0.29 ± 0.02 mushroom spines/μm; *p < 0.05) and a 26% decrease in the number of stubby spines (wild type, 0.31 ± 0.03; knock-out, 0.22 ± 0.02 stubby spines/μm; *p < 0.05), whereas the total number of all spine types per micrometer of dendrite was not significantly different from wild-type levels. B, The length of mushroom spines was increased by 22% in the knock-outs compared with wild type (wild type, 0.79 ± 0.03 μm; knock-out, 0.96 ± 0.02 μm; **p < 0.01), whereas the lengths of stubby and thin spines were unchanged. C, The head diameters of mushroom, stubby, and thin spines were unchanged in densin knock-out compared with wild-type mice. D, Loss of densin resulted in a 22% decrease in the neck diameter of mushroom spines (wild type, 0.17 ± 0.01 μm; knock-out, 0.13 ± 0.01 μm; *p < 0.05). E, Representative images of dendrites in stratum radiatum of the CA1 region from wild-type and densin knock-out mice. For A–D, statistical significance was determined with two-tailed t tests on measurements of 110 mushroom, 163 stubby, 112 thin spines (385 total) from 3 wild-type mice and 187 mushroom, 154 stubby, 129 thin (475 total) from 3 densin knock-out mice. Error bars represent SEM.

References

    1. Achim AM, Maziade M, Raymond E, Olivier D, Mérette C, Roy MA. How prevalent are anxiety disorders in schizophrenia? A meta-analysis and critical review on a significant association. Schizophr Bull. 2011;37:811–821. - PMC - PubMed
    1. Apperson ML, Moon IS, Kennedy MB. Characterization of densin-180, a new brain-specific synaptic protein of the O-sialoglycoprotein family. J Neurosci. 1996;16:6839–6852. - PMC - PubMed
    1. Arguello PA, Gogos JA. Modeling madness in mice: one piece at a time. Neuron. 2006;52:179–196. - PubMed
    1. Barria A, Malinow R. NMDA receptor subunit composition controls synaptic plasticity by regulating binding to CaMKII. Neuron. 2005;48:289–301. - PubMed
    1. Belforte JE, Zsiros V, Sklar ER, Jiang Z, Yu G, Li Y, Quinlan EM, Nakazawa K. Postnatal NMDA receptor ablation in corticolimbic interneurons confers schizophrenia-like phenotypes. Nat Neurosci. 2010;13:76–83. - PMC - PubMed

Publication types

MeSH terms