. 2011 Nov 9;31(45):16353-68.
doi: 10.1523/JNEUROSCI.3009-11.2011.

Two distinct modes of forebrain circuit dynamics underlie temporal patterning in the vocalizations of young songbirds

Affiliations

Two distinct modes of forebrain circuit dynamics underlie temporal patterning in the vocalizations of young songbirds

Dmitriy Aronov et al. J Neurosci. .

Abstract

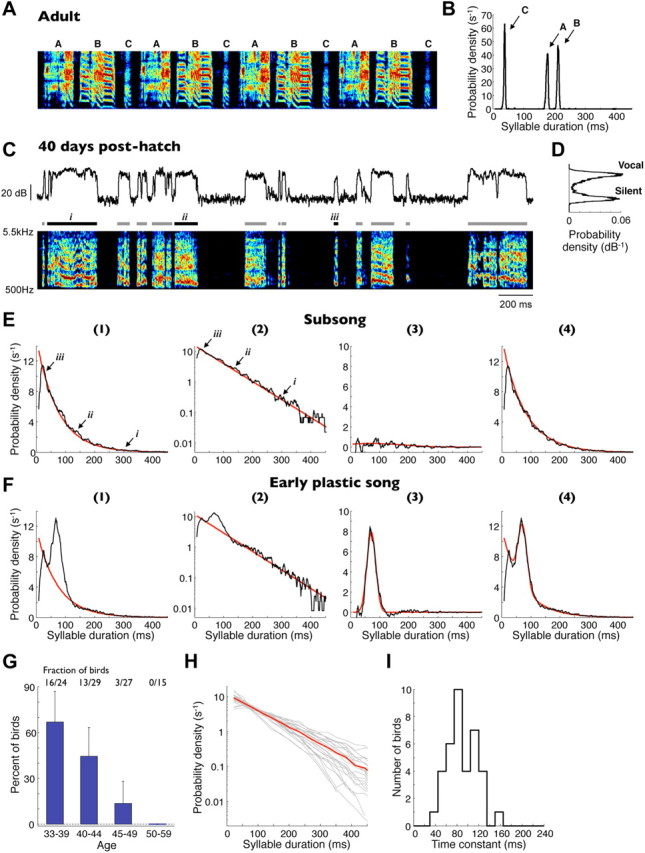
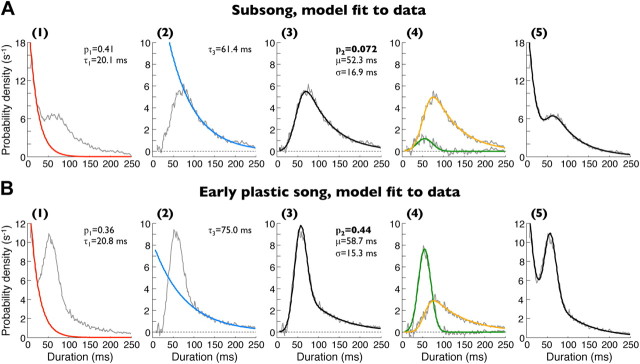
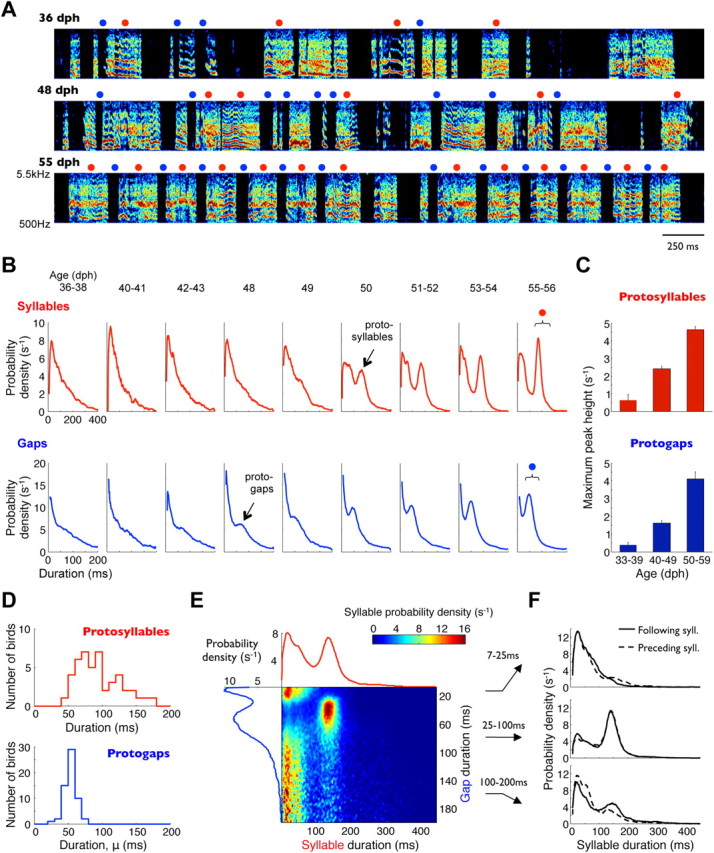
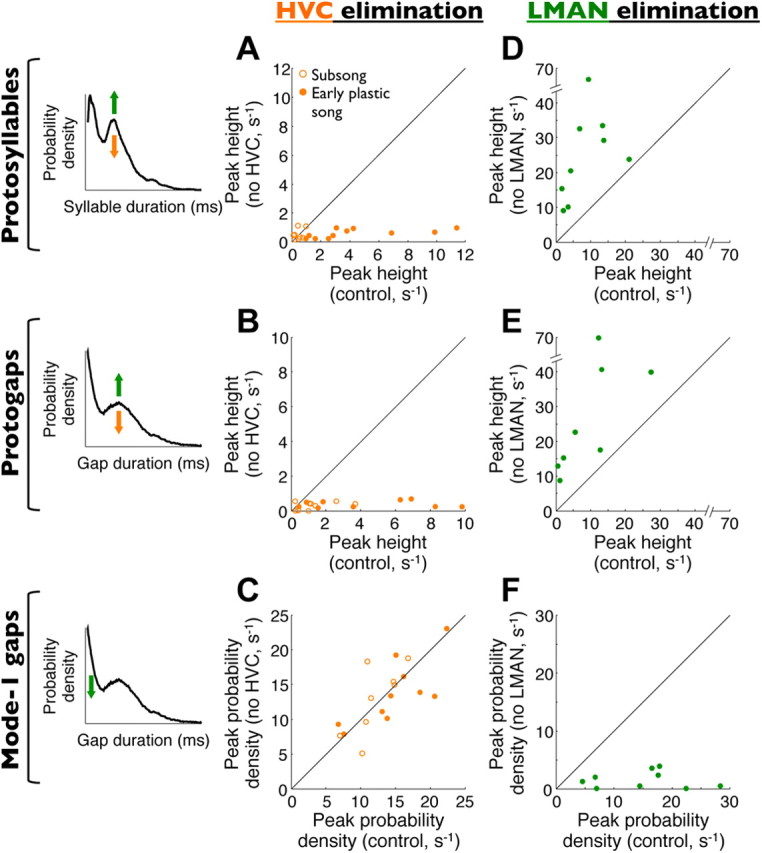
Accurate timing is a critical aspect of motor control, yet the temporal structure of many mature behaviors emerges during learning from highly variable exploratory actions. How does a developing brain acquire the precise control of timing in behavioral sequences? To investigate the development of timing, we analyzed the songs of young juvenile zebra finches. These highly variable vocalizations, akin to human babbling, gradually develop into temporally stereotyped adult songs. We find that the durations of syllables and silences in juvenile singing are formed by a mixture of two distinct modes of timing: a random mode producing broadly distributed durations early in development, and a stereotyped mode underlying the gradual emergence of stereotyped durations. Using lesions, inactivations, and localized brain cooling, we investigated the roles of neural dynamics within two premotor cortical areas in the production of these temporal modes. We find that LMAN (lateral magnocellular nucleus of the nidopallium) is required specifically for the generation of the random mode of timing and that mild cooling of LMAN causes an increase in the durations produced by this mode. On the contrary, HVC (used as a proper name) is required specifically for producing the stereotyped mode of timing, and its cooling causes a slowing of all stereotyped components. These results show that two neural pathways contribute to the timing of juvenile songs and suggest an interesting organization in the forebrain, whereby different brain areas are specialized for the production of distinct forms of neural dynamics.


Figures

Figure 1.
Figure 1.
Subsong exhibits exponential distributions of syllable durations. A, Spectrogram of a typical adult zebra finch song. Three distinct syllable types are labeled A–C. B, Syllable duration distribution of all recorded renditions of this song illustrating the highly stereotyped syllable durations. C, Bottom, Spectrogram of a typical song produced by a 40 dph juvenile zebra finch. Bars above indicate detected syllables. Top trace, Song amplitude (log units, decibels) in the 1–4 kHz band. D, Distribution of song amplitudes for the song sample shown. E, Syllable duration distribution (black traces) for the same bird on (1) a linear and (2) a semi-log scale. The distribution is well fit by an exponential function (red traces). Labels i–iii indicate durations of syllables shown in C. (3) The residual (black trace) of the distribution after the subtraction of the exponential fit. Also shown is a Gaussian fit to this residual (red trace). (4) Overall gap duration distribution (black trace) and a sum of the exponential and Gaussian fits (red trace). F, Same fits for syllable durations of a bird in the early plastic-song phase. The distribution deviates from an exponential attributable to the appearance of a peak (Gaussian fit). G, Fraction of birds whose syllables are well fit by exponential distributions (Lilliefors statistic; see Materials and Methods) for different age groups. Error bars indicate 95% confidence intervals for a binomial distribution. H, Syllable duration distributions for all subsong birds (gray lines) and the population average (red line). For clarity, only birds with >2000 recorded syllables are shown. I, Distribution of exponential time constants for all distributions shown in H.
Figure 2.
Figure 2.
Silent gaps in subsong are shaped by a diversity of respiratory patterns. Except D, all examples shown are from a single typical subsong bird (47 dph). A, Syllable duration distribution, exhibiting an exponential shape. B, Gap duration distribution, exhibiting a complex mixture of timescales including a peak at ∼70 ms. C, Same gap duration distribution shown with a logarithmic vertical axis. Red line, Exponential fit to short gaps (<30 ms). Blue line, Exponential fit to gaps at 100–200 ms. The long tail deviates from an exponential fit at ∼300 ms. D, Gap duration distribution on a log–log scale. Dashed line, Power-law fit to the data between 300 ms and 30 s. Because the tail contains very few data points, data are shown for a bird from which an exceptionally large amount of singing was recorded. E, Spectrogram showing several bouts of subsong with simultaneous air sac pressure recording. Periods of positive and negative pressure are indicated with magenta and green, respectively. Gaps labeled i–iv correspond to those labeled in B–D. Bottom, Detail of the recording, showing four EPs, during which 1, 1, 3, and 0 syllables (black bars) are produced. F, Examples of mode-1 gaps, which contain continuous expiratory pressures. G, Examples of mode-2 gaps, which are filled by a single IP. H, Examples of mode-3 gaps, which contain an IP and extended intervals of nonvocalized positive pressure. Note that mode-2 and mode-3 gaps form a continuum; although we illustrate them as two extremes here, the analysis performed does not classify individual gaps as belonging to mode-2 or mode-3. I, Examples of mode-4 gaps, which contain eupneic breathing. The top examples in F–I are the gaps highlighted in B–E (labeled i–iv).
Figure 3.
Figure 3.
Gap durations are formed by the underlying respiratory patterns. A, Model of the respiratory timescales that generate different modes of gap durations. Schematics illustrate all parameters of the gap duration distributions described in Results. B, An exponential distribution (time constant τ1) is used to model the durations of expiratory (mode-1) gaps. C, Gap duration distribution of a subsong bird overlaid with the distribution of mode-1 gaps (red trace). The distributions overlap well at short durations. D, Histogram of mode-1 gap timescales (τ1), determined from exponential fits to the overall gap duration distribution at short durations (less than ∼30 ms; see Materials and Methods). Red symbols show mode-1 gap timescales directly determined from birds with air sac pressure measurements. E, A Gaussian distribution (mean μ, SD σ) is used to model the distribution of gaps whose durations are tightly coupled to IP durations (mode-2 gaps). F, Gap duration distribution and IP duration distribution (green trace), measured in the same bird and rescaled to match peak height. G, Histogram of peak centers identified in gap duration distributions, μ. Green symbols show average IP durations directly determined from air sac pressure measurements. H, Mode-3 gap durations are modeled by the sum of an exponentially distributed expiratory period duration (time constant τ3, blue trace) and a Gaussian-distributed IP duration (green trace), forming an ex-Gaussian duration distribution (orange trace). I, Gap duration distribution plotted with the distribution of positive-pressure periods in mode-3 gaps, shifted by the mean IP duration (blue trace). J, Histogram of long (100–200 ms) gap timescales (τ3). Blue symbols show timescales of the positive-pressure periods in mode-3 gaps, directly determined from air sac pressure measurements.
Figure 4.
Figure 4.
Analysis of gap durations in subsong (A) and early plastic song (B). (1) Gap duration distribution with exponential fit to short gap durations (red trace; see Materials and Methods). The fit was used to estimate the fraction (p1) and time constant (τ1) of mode-1 gaps. (2) Residual after the subtraction of the mode-1 exponential fit from the gap duration distribution (gray trace). Overlaid is another exponential fit to this residual at long durations (100–200 ms, blue trace). The fit was used to estimate the exponential time constant of the ex-Gaussian model of mode-3 gaps (τ3). (3) Fit of a weighted sum of a Gaussian and an ex-Gaussian distribution to the same residual, used to estimate the parameters of mode-2 and mode-3 gaps. (4) Gray traces, Residual shown in (3), after subtractions of either of the individual components of the fit (Gaussian or ex-Gaussian). Green and orange traces show the Gaussian and ex-Gaussian components of the fit separately. Amplitude of the Gaussian component (p2, green trace), describing the contribution of mode-2 gaps, is substantially greater in plastic song than in subsong. Note that individual gaps in this step have not been classified as mode-2 or mode-3; the distributions only show how much of the fit in (3) was assigned to the Gaussian and the ex-Gaussian modes. (5) Overall gap duration distribution from the same bird (gray trace) and the fit of the full model (black trace; weighted sum of an exponential, a Gaussian, and an ex-Gaussian).
Figure 5.
Figure 5.
Early song development is characterized by appearance of consistent timing. A, Spectrograms of songs produced by one bird at three developmental stages. Red circles, Syllables 140–240 ms long. Blue circles, Gaps 30–90 ms long. B, Developmental progression of syllable and gap duration distributions from the same bird. Brackets indicate duration ranges marked above (red and blue circles). C, Heights of peaks in syllable and gap duration distributions (corresponding to protosyllables and protogaps), quantified across all birds. Bars indicate median values across birds in a given age group; error bars are bootstrap SEMs. D, Distributions of protosyllable and protogap durations across all birds. E, Probability distribution of all consecutive syllable and gap durations in an early plastic-song bird. Each row of the color-coded matrix is individually normalized to a sum of 1, such that values indicate syllable durations conditional on gap duration. Also shown are the overall gap duration distribution (blue trace, left) and syllable duration distribution (red trace, top). F, Duration distributions of syllables that precede and follow gaps of three different duration ranges. Protogaps and protosyllables tend to follow each other.
Figure 6.
Figure 6.
Effects of HVC elimination on early singing. A, Typical spectrograms of a subsong bird before and after complete bilateral HVC lesions. Blue circles, Gaps 30–90 ms long. Syllable duration (B) and gap duration distributions (C) for the same bird before and after the lesions. Bracket indicates the duration range marked above. D–F, Same plots for an early plastic-song bird before and after HVC lesion. Red circles, Syllables 80–120 ms long. Blue circles, Gaps 30–90 ms long. G, Analysis of the temporal modes in normal plastic-song gap distribution. Data are plotted the same way as in Figure 4. H, Analysis of gaps produced by the same bird after bilateral HVC lesions. Note that the major effect of the lesion was the elimination of mode-2 gaps [(4), Gaussian fit, green trace].
Figure 7.
Figure 7.
Effects of LMAN elimination on early singing. A, Typical spectrograms of an early plastic-song bird before and after bilateral LMAN inactivation. Red circles, Syllables 60–110 ms long. Blue circles, Gaps 30–60 ms long. Syllable duration (B) and gap duration (C) distribution for the same bird before inactivation (black trace) and after inactivation (green trace). Brackets indicate duration ranges marked above.
Figure 8.
Figure 8.
Summary of bilateral HVC and LMAN elimination experiments across birds. Note that only HVC eliminations are shown for subsong birds because these do not sing after LMAN inactivations (Aronov et al., 2008). Left column, Schematic illustrations of the effects of HVC elimination (orange arrows) and LMAN elimination (green arrows) on syllable and gap distributions. A, Scatter plot of the size of the peak in syllable durations (protosyllables) before and after HVC elimination. B, Size of the peak in gap durations (protogaps) before and after HVC elimination, calculated as the magnitude of the components corresponding to mode-2 gaps. C, Fraction of mode-1 (expiratory) gaps before and after HVC elimination. D–F, Effects of LMAN elimination on the same quantities as those shown in A–C.
Figure 9.
Figure 9.
Calibration of devices for cooling HVC and LMAN in juvenile zebra finches. A, Left, Schematic of the device for cooling HVC using cooling pads placed against thinned cranium above HVC. Right, Temperature change at the cooling plate of the device and in the center of HVC measured in an awake bird. Current is alternated between −0.5 and 1.5 A every 100 s. The same protocol is used for all cooling experiments reported here. B, Left, Schematic of the device for cooling LMAN using thermally conductive probes. Right, Temperature change in LMAN at various distances from the cooling probe of the device using the same electric current protocol. C, Approximate locations of cooling probes in LMAN for all analyzed birds. The probes in the left and right hemisphere of each bird are indicated by circles of matching color. Note that probe diameter was 250 μm in some birds and 330 μm in others (indicated by smaller and larger circles). A, Anterior; L, lateral. D, Example of simulated temperature around the probe in a horizontal section of LMAN (see Materials and Methods).
Figure 10.
Figure 10.
Biophysical dynamics intrinsic to HVC and LMAN are involved in timing different components of early singing. A, Distributions of subsong syllable durations produced by a single bird at normal body temperature and during HVC cooling, plotted on a semi-logarithmic scale. HVC cooling had no effect on subsong syllable durations. B, Syllable duration distributions for a plastic song bird on a linear scale. HVC cooling increased protosyllable durations. C, Effect of HVC cooling on gap duration distributions. (1) Detail of the gap duration distribution at short durations, plotted on a semi-logarithmic scale. HVC cooling had no effect on mode-1 (expiratory) gaps. (2) Detail of the gap duration distribution on a linear scale, showing the protogap peak. HVC cooling prolonged protogaps. D–F, Effects of LMAN cooling on syllable and gap durations, plotted as in A–C. D, LMAN cooling prolonged subsong syllables. E, LMAN cooling had no effect on the durations of protosyllables in plastic song. F, LMAN cooling increased the duration of mode-1 gaps (1) but had no effect on the durations of protogaps (2). G, Population summary of the effect of HVC cooling (orange) and LMAN cooling (green) on subsong syllable durations. Each dot indicates the effect for an individual bird. Open dots indicate the examples shown in A and D. Error bars indicate SEs across all birds. H–J, Population summary of the effects of HVC and LMAN cooling on protosyllable durations, mode-1 gap timescales, and protogap durations. Asterisks indicate features that showed a significant change with cooling across the population of birds (p < 0.05).

Similar articles

Cited by

References

    1. Abeles M. Corticonics. Cambridge, UK: Cambridge UP; 1991.
    1. Andalman AS, Fee MS. A basal ganglia-forebrain circuit in the songbird biases motor output to avoid vocal errors. Proc Natl Acad Sci U S A. 2009;106:12518–12523. - PMC - PubMed
    1. Andalman AS, Foerster JN, Fee MS. Control of vocal and respiratory patterns in birdsong: dissection of forebrain and brainstem mechanisms using temperature. PloS One. 2011;6:e25461. - PMC - PubMed
    1. Aronov D, Fee MS. Analyzing the dynamics of brain circuits with temperature: design and implementation of a miniature thermoelectric device. J Neurosci Methods. 2011;197:32–47. - PMC - PubMed
    1. Aronov D, Andalman AS, Fee MS. A specialized forebrain circuit for vocal babbling in the juvenile songbird. Science. 2008;320:630–634. - PubMed

Publication types

MeSH terms

LinkOut - more resources