. 2011 Nov 9;31(45):16387-97.
doi: 10.1523/JNEUROSCI.3770-11.2011.

Tonic nanomolar dopamine enables an activity-dependent phase recovery mechanism that persistently alters the maximal conductance of the hyperpolarization-activated current in a rhythmically active neuron

Affiliations

Tonic nanomolar dopamine enables an activity-dependent phase recovery mechanism that persistently alters the maximal conductance of the hyperpolarization-activated current in a rhythmically active neuron

Edmund W Rodgers et al. J Neurosci. .

Abstract

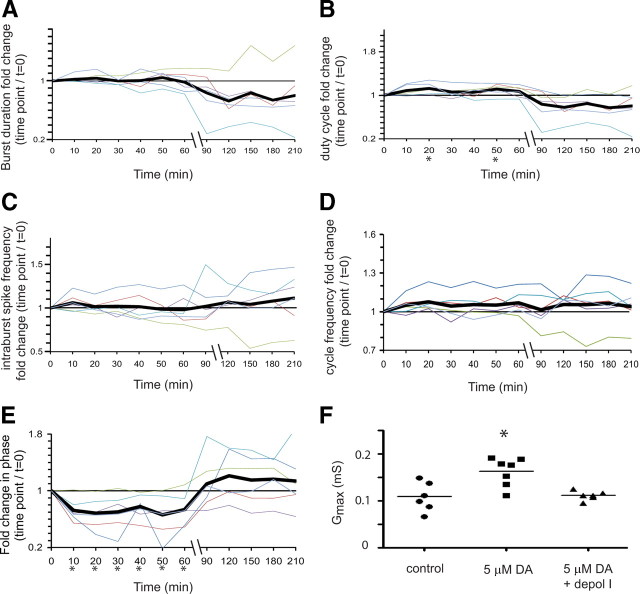
The phases at which network neurons fire in rhythmic motor outputs are critically important for the proper generation of motor behaviors. The pyloric network in the crustacean stomatogastric ganglion generates a rhythmic motor output wherein neuronal phase relationships are remarkably invariant across individuals and throughout lifetimes. The mechanisms for maintaining these robust phase relationships over the long-term are not well described. Here we show that tonic nanomolar dopamine (DA) acts at type 1 DA receptors (D1Rs) to enable an activity-dependent mechanism that can contribute to phase maintenance in the lateral pyloric (LP) neuron. The LP displays continuous rhythmic bursting. The activity-dependent mechanism was triggered by a prolonged decrease in LP burst duration, and it generated a persistent increase in the maximal conductance (G(max)) of the LP hyperpolarization-activated current (I(h)), but only in the presence of steady-state DA. Interestingly, micromolar DA produces an LP phase advance accompanied by a decrease in LP burst duration that abolishes normal LP network function. During a 1 h application of micromolar DA, LP phase recovered over tens of minutes because, the activity-dependent mechanism enabled by steady-state DA was triggered by the micromolar DA-induced decrease in LP burst duration. Presumably, this mechanism restored normal LP network function. These data suggest steady-state DA may enable homeostatic mechanisms that maintain motor network output during protracted neuromodulation. This DA-enabled, activity-dependent mechanism to preserve phase may be broadly relevant, as diminished dopaminergic tone has recently been shown to reduce I(h) in rhythmically active neurons in the mammalian brain.


Figures

Figure 1.
Figure 1.
Experimental preparation and protocol. A, Diagram of the dissected STNS pinned in a dish with a Vaseline well (gray, open rectangle) around the STG. All descending inputs project to the STG through the stn. There are ∼30 neurons in the STG. The single LP is diagrammed. The LP sends its axon through the dvn and lvn as it projects to its target muscles (small, stippled rectangles). B, The spontaneous motor output of the pyloric network. Top trace is a representative LP intracellular recording showing spontaneous, rhythmic oscillations in membrane potential and spikes on a depolarized plateau. Lower traces are extracellular recordings from the pdn and the lvn in the same experiment. The pdn exclusively contains the two axons from the two PDs in the STG. The lvn contains several axons including those from the LP, PD and PY neurons, whose spikes are seen on the traces. Parameters measured from the traces: a, LP burst duration and intraburst spike frequency; b, cycle period; c, LP-on delay. C, Pyloric circuit. Open circles represent pyloric neurons: pacemaker kernel = anterior burster (AB) with two PD cells; follower cells = one LP neuron and 8 PY cells. Filled circles represent inhibitory chemical synapses (PD, acetylcholine; all others, glutamate). Resistors represent electrical coupling. It should be noted that this is a reduced pyloric circuit and only 4 of 6 cell types are represented. D, Experimental timeline. The STNS was dissected and cells were identified. This process typically took 3–5 h. The end of cell identification marked t = 0. At this point, Panulirus saline (control) or DA (DA-treated) was superfused for 1 h, followed by a 3 h wash with Panulirus saline. At t = 4 h a sucrose block was applied to the stn and the STG was superfused with blocking saline for 1 h, after which TEVC was used to measure LP currents. Both lvn and pdn recordings were maintained from t = 0–4 h.
Figure 2.
Figure 2.
Tonic application of 5 μm DA triggered a slow phase recovery mechanism. The experiments in Figure 1D were performed for control, 5 nm, and 5 μm DA treatment groups; and LP-on phase was measured every 10 min for the first hour and every 30 min thereafter. Some 5 μm DA preparations also received 0.5 mm Cs from t = 0–4 h. A, There are no significant differences in LP-on phase between treatment groups. LP-on phase (mean + SD) is plotted over time for the four treatment groups. Vertical slashes on the x-axis indicate a change in scale. There were no significant differences between treatment groups at any time point examined (two-way ANOVA: treatment, F(3,253) = 0.2340, p = 0.8718; time, F(11,253) = 5.020, p < 0.0001 (see B–E); interaction, F(33,253) = 3.531, p < 0.0001). B–D, There are significant changes in LP-on phase over time within treatment groups. Fold changes in LP-on phase are plotted over time for a given treatment group. Each thin line represents the fold change (t/t = 0) in LP-on phase throughout one experiment. The thick black line in each graph represents the average fold change for the treatment group. Highlighted time points indicate the period of DA application. Asterisks indicate significantly different from t = 0, as determined using repeated-measures ANOVAs with Dunnett's post hoc tests that compares all time points to t = 0. (B, control: F(11,6) = 1.926, p = 0.0515; C, 5 nm DA: F(11,8) = 4.253, p < 0.0001; D, 5 μm DA: F(11,5) = 9.72, p < 0.0001). E, A Cs dose–response curve showing the fraction of Ih remaining as increasing concentrations of Cs were sequentially superfused into the Vaseline well surrounding the STG. Ih Gmax was measured using TEVC 10 min after a given Cs concentration entered the bath. Fraction of Ih remaining was determined to be: (Gmax in x mm Cs) ÷ (Gmax in 0 Cs). Each data point represents the mean and SD for 3 experiments. F, Cs prevents LP-on phase recovery. Fold changes are plotted over time for the 5 μm DA treatment group that also received 0.5 mm Cs from t = 0–4 h (black line under x-axis). *Significantly different from t = 0 using a repeated-measures ANOVA with a Dunnett's post hoc test (F(11,4) = 4.2, p = 0.0003).
Figure 3.
Figure 3.
5 μm DA caused a persistent increase in LP Ih Gmax by the end of the experiment diagrammed in Figure 1D. A, Typical LP Ih current traces elicited by a series of hyperpolarizing steps using TEVC. Acute measures were obtained by blocking from t = 0–1 h followed by TEVC. Control and DA treatment groups were obtained as diagrammed in Figure 1D. B, Plots of normalized voltage dependence of activation for LP Ih are not significantly different across the four treatment groups. Using TEVC, the LP was held at −50 mV and subjected to a series of hyperpolarizing test pulses. Conductance was obtained for each test pulse and normalized by the conductance for the −120 mV test pulse. Each data point represents the mean ± SD for n ≥ 6. C, Plots of LP Ih Gmax for the four experimental preparations. Each symbol represents the LP Ih Gmax measured with TEVC at the end of one experiment. Horizontal line represents the mean for the group. *Significantly different from acute, control and 5 nm DA as determined using a one-way ANOVA with Tukey's post hoc test: F(3,25) = 5.619, p = 0.0051. Acute, control, and 5 nm DA treatment groups were not significantly different from one another (Tukey's, p > 0.05).
Figure 4.
Figure 4.
LP burst duration significantly decreased during the first hour of the experiment diagrammed in Figure 1D for 5 μm, but not control or 5 nm DA preparations. A, Plot of LP burst duration (mean + SD) for the 3 treatment groups at 10 min intervals during the first hour of the experiment, and every 30 min thereafter. Vertical slashes on the x-axis indicate a change in scale. There were no significant differences between treatment groups at any time point (two-way ANOVA: treatment, F(2,253) = 0.008879, p = 0.9912; time, F(11,253) = 3.888, p < 0.0001 (see B–D); interaction, F(22,253) = 1.794, p = 0.0178). B–D, Fold changes in burst duration over time within a treatment group. Each thin line represents one experiment and is a plot of the fold change (t/t = 0) in LP burst duration throughout the experiment diagrammed in Figure 1D. Thick black lines represent average fold changes. Highlighted data points represent the period of DA application. *Significantly different from t = 0, as determined using repeated-measures ANOVAs with Dunnett's post hoc tests that compare all time points to t = 0 (B, control: F(11,8) = 3.723, p = 0.0002; C, 5 nm DA: F(11,8) = 1.017, p = 0.4386; D, 5 μm DA: F(11,7) = 3.235, p = 0.0011).
Figure 5.
Figure 5.
Fold changes in LP duty cycle during the experiments illustrated in Figure 1D. A, LP duty cycle (mean + SD) is plotted every 10 min for the first hour of the experiment and every 30 min thereafter. Vertical slashes on the x-axis indicate a change in scale. There were no significant differences in duty cycle between the three treatment groups at any time point examined (two-way ANOVA: treatment, F(2,231) = 0.09067, p = 0.9137; time, F(11,231) = 2.826, p = 0.0018; interaction, F(22,231) = 1.554, p = 0.0587). B–D, Fold changes in duty cycle over time within each treatment group. Each thin line represents one experiment and is a plot of the fold change (t/t = 0) in LP duty cycle throughout the experiment diagrammed in Figure 1D. Thick black lines represent average fold changes. Highlighted data points represent the period of DA application. *Significantly different from control as determined using repeated-measures ANOVAs with Dunnett's post hoc tests that compare all time points to t = 0 (B, control: F(11,7) = 0.8325, p = 0.6084; C, 5 nm DA: F(11,9) = 1.918, p = 0.0458; D, 5 μm DA: F(11,7) = 3.265, p = 0.0011).
Figure 6.
Figure 6.
LP intraburst spike frequency significantly increased during the first hour of the experiment illustrated in Figure 1D for control but not 5 nm or 5 μm DA preparations. A, LP intraburst spike frequency (mean + SD) is plotted for the three treatment groups every 10 min for the first hour of the experiment and every 30 min thereafter. Vertical slashes on the x-axis indicate a change in scale. There were no significant differences between the three treatment groups at any given time point (two-way ANOVA: treatment, F(2,220) = 1.574, p = 0.2319; time, F(11,220) = 2.924, p = 0.0013 (see B–D); interaction, F(22,220) = 1.039, p = 0.4184). B–D, Fold changes in intraburst spike frequency over time within a treatment group. Each thin line represents a plot of the fold change (t/t = 0) in LP intraburst spike frequency during one experiment. Thick black lines represent average fold changes. Highlighted data points represent period of DA application. *Significantly different from t = 0 as determined using repeated-measures ANOVAs with Dunnett's post hoc tests that compare all time points to t = 0 (B, control: F(11,9) = 3.690, p = 0.0002; C, 5 nm DA: F(11,6) = 1.401, p = 0.1935; D, 5 μm DA: F(11,6) = 0.5352, p = 0.8724).
Figure 7.
Figure 7.
Pyloric cycle frequency is significantly increased during the first hour of the experiment diagrammed in Figure 1D for 5 μm, but not control or 5 nm DA preparations. A, Plot of pyloric cycle frequency (mean + SD) for the three preparations at 10 min intervals during the first hour of the experiment and every 30 min thereafter. Vertical slashes on the x-axis represent a change in scale. There were no significant differences between treatment groups at any time point (two-way ANOVA: treatment, F(2,385) = 1.283, p = 0.2900; time, F(11,385) = 2.285, p = 0.0103 (see B–D); interaction, F(22,385) = 3.829, p < 0.0001). B–D, Fold changes in pyloric cycle frequency over time within a treatment group. Each thin line represents a plot of the fold change (t/t = 0) in cycle frequency throughout one experiment. Thick black lines represent the average fold changes. Highlighted data points represent the period of DA application. *Significantly different from t = 0, as determined using repeated-measures ANOVAs with Dunnett's post hoc tests that compare all time points to t = 0 (B, control: F(11,9) = 4.288, p < 0.0001; C, 5 nm DA: F(11,14) = 0.9297, p = 0.5136; D, 5 μm DA: F(11,12) = 2.931, p = 0.0017).
Figure 8.
Figure 8.
A reduction in LP burst duration is necessary to elicit slow phase recovery. The experiment illustrated in Figure 1D was performed for the 5 μm DA treatment group with depolarizing current injections from t = 0–1 h. A–E, The fold changes (t/t = 0) in LP burst duration (A), LP duty cycle (B), LP intraburst spike frequency (C) pyloric cycle frequency (D) and LP-on phase (E) were plotted every 10 min for the first hour of the experiment and every 30 min thereafter. Vertical slashes on the x-axis represent a change in scale. Each thin line represents one experiment. Thick black lines represent the average fold changes. Highlighted data points represent the period of DA application. *Significantly different from t = 0 as determined using repeated-measures ANOVAs with Dunnett's post hoc tests that compared all time points up to t = 60 min with t = 0 (A, LP burst duration: F(11,5) = 0.7345, p = 0.6257; B, LP duty cycle: F(11,5) = 2.453, p = 0.0413; C, LP intraburst spike frequency: F(11,5) = 0.7780, p = 0.5936; D, pyloric cycle frequency: F(11,5) = 1.758, p = 0.1419; E, LP-on phase: F(11,5) = 5.188, p = 0.0009). F, Depolarizing current injection prevented the increase in LP Ih Gmax in 5 μm DA. LP Ih Gmax was plotted for control, 5 μm DA and 5 μm DA with depolarizing current injection (depol I). Each symbol represents one experiment. *Significantly different from control and 5 μm DA with depol I, as determined with a one-way ANOVA with Tukey post hoc test, F(2,18) = 8.976, p = 0.0024.
Figure 9.
Figure 9.
DA and decreased activity are both necessary to produce a significant increase in LP Ih Gmax. A, A typical LP intracellular recording showing voltage trace over time and lvn and pdn extracellular traces before and after TTX application for experiments illustrated in Figure 1D. Note that TTX was applied from t = −10 min 1 h. Calibrations: 10 mV, 500 ms. B, Plots of LP Ih Gmax at the end of the experiments diagrammed in Figure 1D under the indicated conditions. All groups were compared against each other by post hoc analysis, A denotes significant differences from control group, and B denotes significant differences from 5 nm alone as determined using a one-way ANOVA with a Tukey's post hoc test, F(5,36) = 5.832, p = 0.0007.
Figure 10.
Figure 10.
5 nm DA permits a decrease in LP burst duration to trigger an increase in LP Ih Gmax. The experiments in Figure 1D were performed for control and 5 nm DA treatment groups, but hyperpolarizing current (hyperpol I) was injected into the LP from t = 0–1 h. A–D, Current injection reduced LP burst duration (A) and duty cycle (B) to the same extent in control and 5 nm preparations, but had no effect on cycle frequency (C) or intraburst spike frequency (D). Solid lines represent fold changes for the 5 nm treatment groups (mean ± SD, n = 5). Dashed lines represent fold changes for the control treatment groups (mean ± SD, n = 5). E, The decrease in burst duration produced an increase in LP Ih Gmax in 5 nm preparations relative to control. *Significant difference, Student's t test, p = 0.002. F, Current injection produced a sustained average LP phase delay in both treatment groups. Solid line represents fold changes for the 5 nm treatment group (mean ± SD, n = 5). Dashed line represents fold changes for the control treatment group (mean ± SD, n = 5).

Similar articles

Cited by

References

    1. Angelo K, London M, Christensen SR, Häusser M. Local and global effects of I(h) distribution in dendrites of mammalian neurons. J Neurosci. 2007;27:8643–8653. - PMC - PubMed
    1. Arimitsu T, Nuriya M, Ikeda K, Takahashi T, Yasui M. Activity-dependent regulation of HCN1 protein in cortical neurons. Biochem Biophys Res Commun. 2009;387:87–91. - PubMed
    1. Bal T, Nagy F, Moulins M. The pyloric central pattern generator in crustacea: a set of conditional neuronal oscillators. J Comp Physiol A Neuroethol Sens Neural Behav Physiol. 1988;163:715–727.
    1. Bender RA, Kirschstein T, Kretz O, Brewster AL, Richichi C, Rüschenschmidt C, Shigemoto R, Beck H, Frotscher M, Baram TZ. Localization of HCN1 channels to presynaptic compartments: novel plasticity that may contribute to hippocampal maturation. J Neurosci. 2007;27:4697–4706. - PMC - PubMed
    1. Borland LM, Michael AC. Voltammetric study of the control of striatal dopamine release by glutamate. J Neurochem. 2004;91:220–229. - PubMed

Publication types

MeSH terms

LinkOut - more resources