. 2011 Nov 9;31(45):16435-46.
doi: 10.1523/JNEUROSCI.2777-11.2011.

Glutamate spillover promotes the generation of NMDA spikes

Affiliations

Glutamate spillover promotes the generation of NMDA spikes

Jason R Chalifoux et al. J Neurosci. .

Abstract

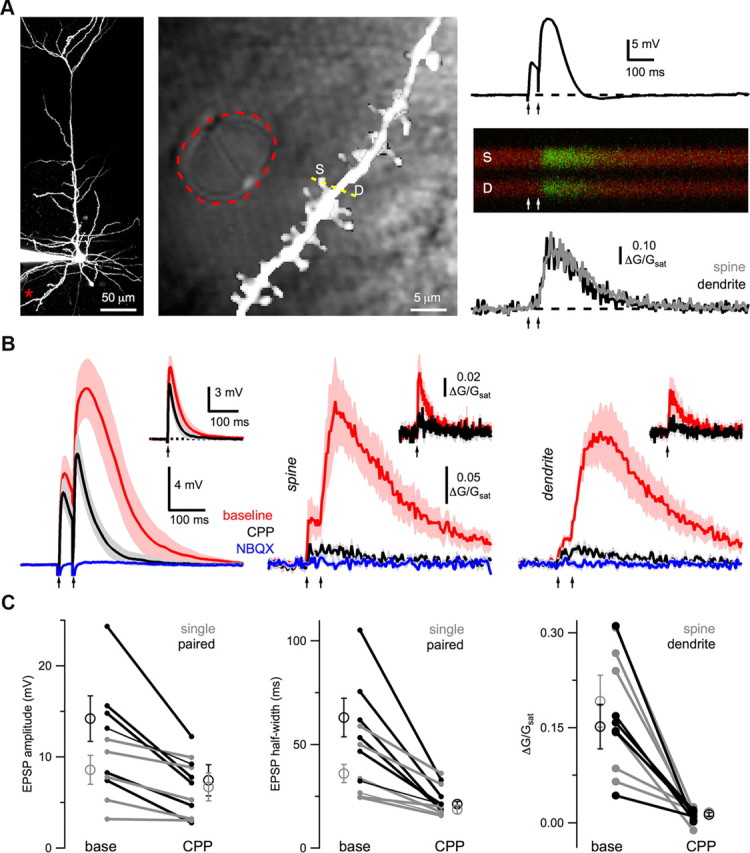
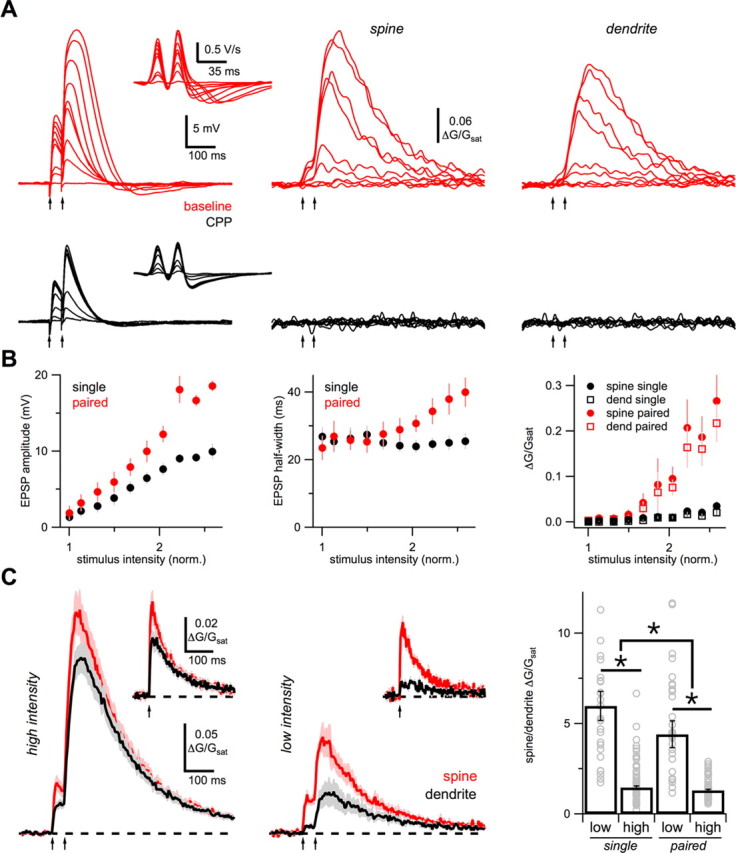
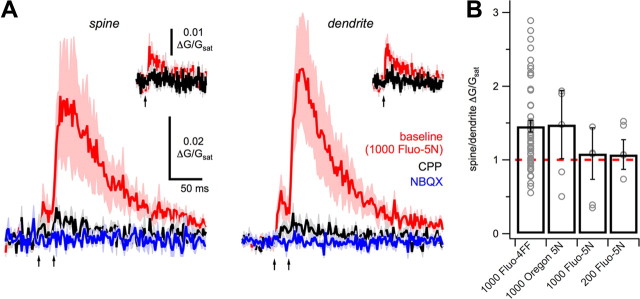
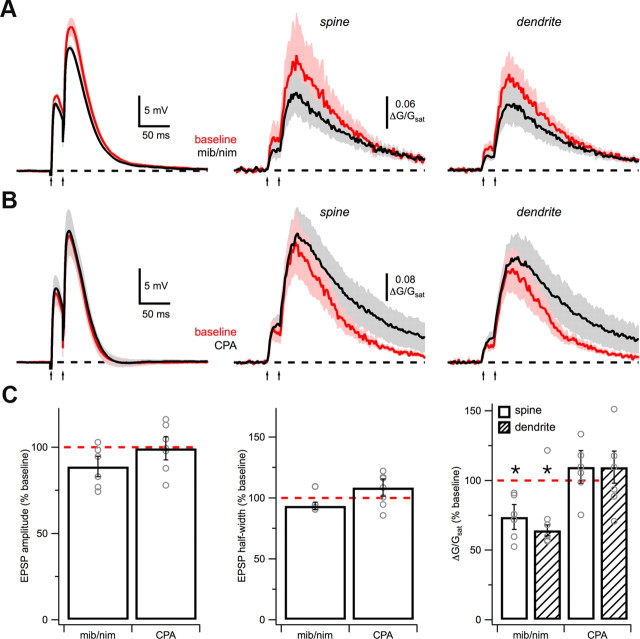
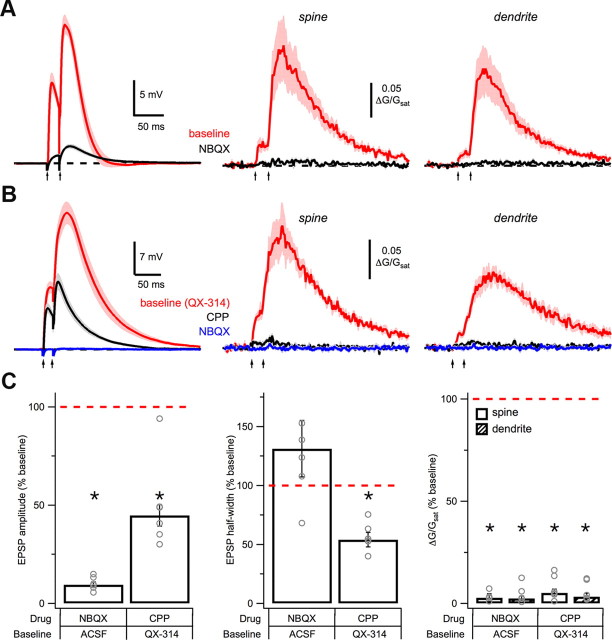
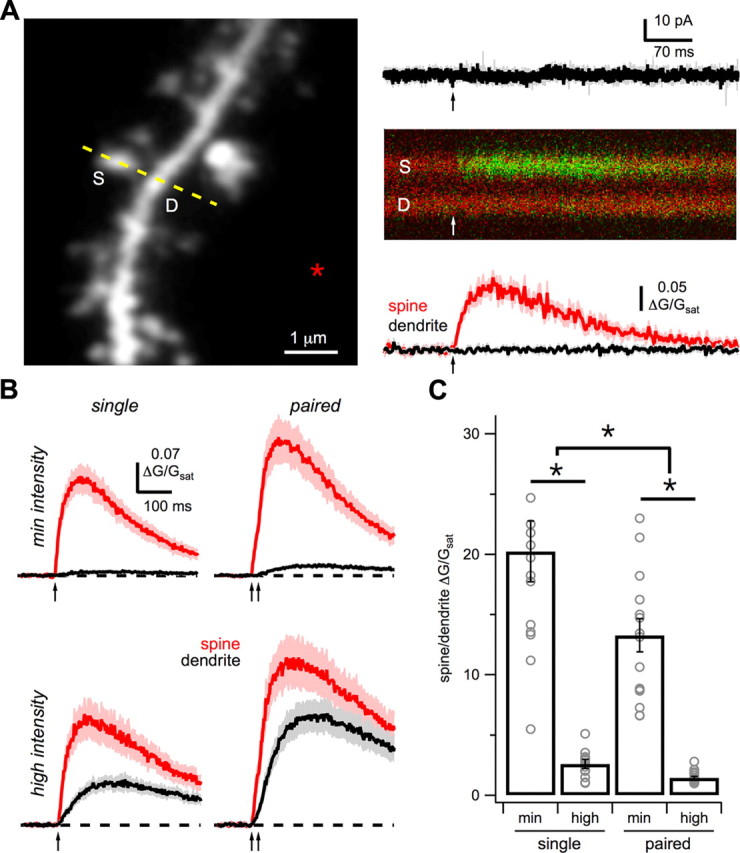
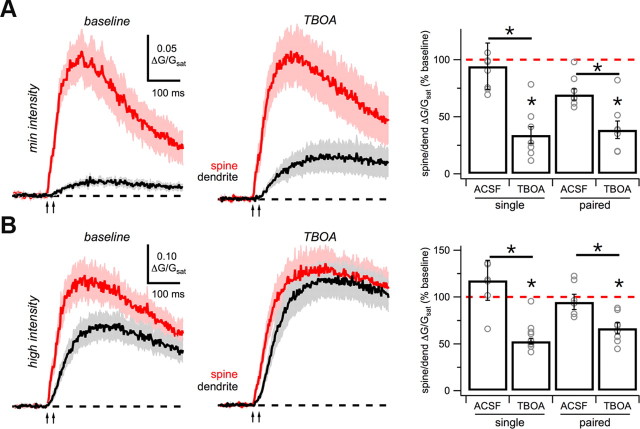
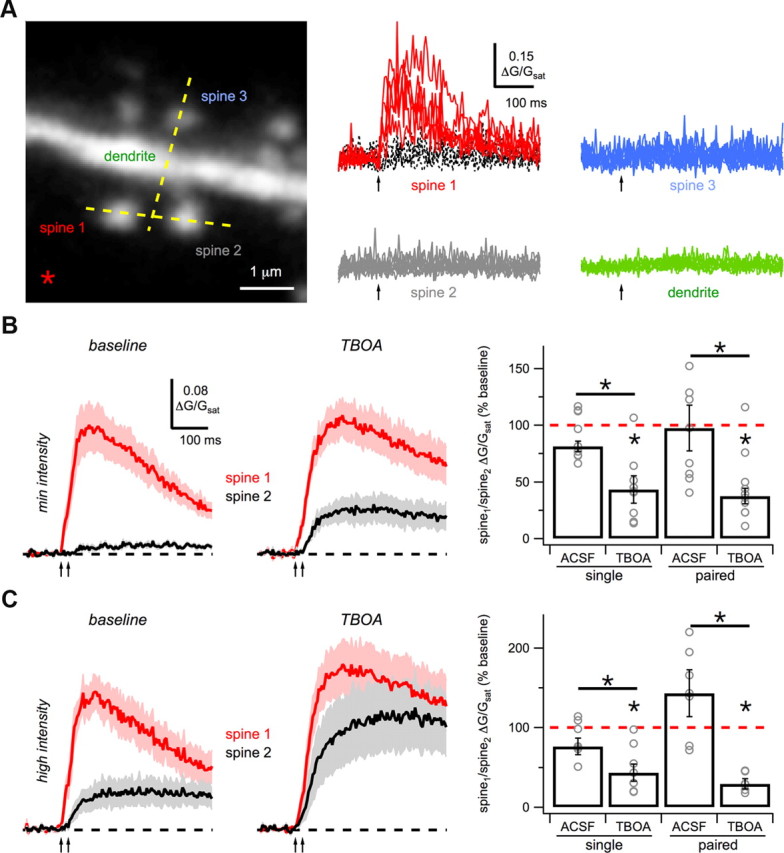
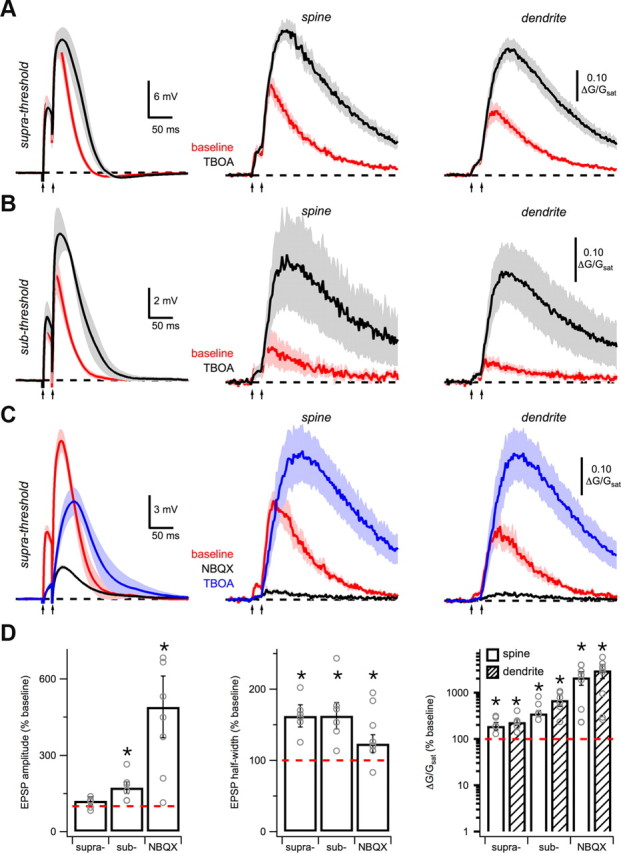
NMDA spikes are prominent in the basal dendrites of cortical pyramidal neurons and greatly expand their ability to integrate synaptic inputs. Calcium (Ca) signals during these spikes are important for synaptic plasticity and fundamentally depend on activation of NMDA receptors. However, the factors that shape the activation of these receptors and the initiation of NMDA spikes remain unclear. Here we examine the properties of NMDA spikes in the basal dendrites of layer 5 pyramidal neurons in the mouse prefrontal cortex. Using two-photon imaging, we demonstrate that NMDA spikes evoke large Ca signals in both postsynaptic spines and nearby dendrites. We find that the dendrite Ca signals depend on NMDA and AMPA receptors but not sodium (Na) or Ca channels. Using voltage-clamp recordings, we show that activation of dendrite NMDA receptors is enhanced by concerted synaptic activity. Blocking glutamate reuptake further increases activation of these receptors and promotes the initiation of NMDA spikes. We conclude that glutamate spillover and recruitment of extrasynaptic receptors contribute to the initiation of NMDA spikes. These results have important implications for how synaptic activity generates both electrical and biochemical signals in dendrites and spines.


Figures

Figure 1.
Figure 1.
NMDA spike Ca signals. A, Left, Two-photon image of a L5 pyramidal neuron, showing the location of the theta-glass stimulating electrode (asterisk). Middle, High-magnification two-photon image overlaid on a laser-scanning DIC image, outlining the theta-glass stimulating electrode (red dashed line) and showing the line-scan (yellow dashed line) through a spine (S) and dendrite (D). Right, Paired-pulse stimulation (arrows) elicits an EPSP (top) and Ca signals (middle) that are quantified as ΔG/Gsat (bottom) in the spine (gray) and dendrite (black). B, Average EPSPs (left) and Ca signals in spines (middle) and dendrites (right) evoked by high-intensity, paired-pulse stimulation (arrows) in baseline conditions (red), after wash-in of 10 μm CPP (black), and subsequent wash-in of 10 μm NBQX (blue). The insets show the response to single-pulse stimulation in baseline conditions (red) and after wash-in of CPP (black). C, Summary of impact of CPP on EPSP amplitude (left), EPSP half-width (middle) and Ca signals (right) in spines (gray) and dendrites (black). Open circles are medians, error bars are SEs of the median, and connected filled circles are individual experiments.
Figure 2.
Figure 2.
Concerted synaptic activity. A, Example experiment showing average EPSPs (left), first derivative of EPSPs (inset), and average Ca signals in spines (middle) and dendrites (right), for paired-pulse stimulation (arrows) at increasing stimulus intensities, in baseline conditions (red) and after wash-in of 10 μm CPP (black). B, Quantification of EPSP amplitude (left), EPSP half-width (middle), and spine (circles) and dendrite (squares) Ca signals (right), for single-pulse (black) and paired-pulse (red) stimuli, normalized to the minimal stimulus intensity. Individual points are means and vertical bars are SEMs. C, Average Ca signals in response to high-intensity (left) and low-intensity (middle) paired-pulse stimulation (arrows) in spines (red) and dendrites (black). Insets show spine (red) and dendrite (black) Ca signals in response to single-pulse stimulation. Right, Summary of SDR for low- and high-intensity, single- and paired-pulse stimulation. Bar graphs are median ± SE of the median. Gray open circles are individual experiments. Outliers are omitted for display purposes. Asterisks indicate significant difference between conditions (p < 0.05).
Figure 3.
Figure 3.
Diffusionally isolated Ca signals. A, Average high-intensity Ca signals in spines (left) and dendrites (right) in baseline conditions (red), after wash-in of 10 μm CPP (black), and subsequent wash-in of 10 μm NBQX (blue), using the low-affinity Ca indicator Fluo-5N (1000 μm). Insets show high-intensity single-pulse EPSPs and Ca signals. B, Summary of SDR using Ca indicators of four different Ca affinities and buffering capacities.
Figure 4.
Figure 4.
Dendrite Ca sources. A, Average EPSPs (left) and Ca signals in spines (middle) and dendrites (right) in response to high-intensity, paired-pulse stimulation (arrows) before (red) and after (black) wash-in of 10 μm mibefradil (mib) and 20 μm nimodipine (nim). B, As in A, for wash-in of 30 μm CPA. C, Summary of impact of mib/nim and CPA on EPSP amplitude (left), EPSP half-width (middle), and Ca signals (right) in spines (open) and dendrites (hash). Asterisks indicate significant difference from 100% (p < 0.05).
Figure 5.
Figure 5.
Postsynaptic depolarization. A, Average EPSPs (left) and Ca signals in spines (middle) and dendrites (right) in response to high-intensity, paired-pulse stimulation (arrows) in baseline conditions (red) and after wash-in of 10 μm NBQX (black). B, As in A, but with internal 5 mm QX-314 in baseline conditions (red), and sequential wash-in of 10 μm CPP (black) and 10 μm NBQX (blue). C, Summary of impact of CPP and NBQX on EPSP amplitude (left), EPSP half-width (middle), and Ca signals (right) in spines (open) and dendrites (hash), in the different baseline conditions. Asterisks indicate significant difference from 100% (p < 0.05).
Figure 6.
Figure 6.
NMDA-R Ca signals. A, Left, Two-photon image stack of a basal dendrite with line-scan (yellow dashed line) through a spine (S) and adjacent dendrite (D), and the position of the theta-glass stimulation electrode (asterisk). Right, Single-pulse stimulation (arrow) in voltage clamp evokes no current while holding at +15 mV (top) but generates a Ca signal in the spine (middle), quantified as ΔG/Gsat (bottom) in the spine (red) and dendrite (black). B, Average Ca signals in spines (red) and dendrites (black) in response to single- (left) and paired-pulse (right) stimulation (arrows) at minimal (top) and high (bottom) intensities in voltage clamp. C, Summary of SDR under the different stimulation conditions. Asterisks indicate significant difference between conditions (p < 0.05).
Figure 7.
Figure 7.
Glutamate spillover onto nearby dendrites. A, Average Ca signals in voltage clamp with minimal-intensity paired-pulse stimulation (arrows) for spines (red) and dendrites (black) under baseline conditions (left) and after wash-in of 10 μm TBOA (middle). Right, Summary of SDR for single- and paired-pulse stimulation after wash-in of ACSF or TBOA. B, As in A, for high-intensity stimulation. Asterisks indicate significant difference from 100% or between ACSF and TBOA (p < 0.05).
Figure 8.
Figure 8.
Glutamate spillover onto nearby spines. A, Left, Two-photon image stack of a basal dendrite showing line-scans (yellow dashed lines) through a spine-spine pair (spine 1 and spine 2) and spine-dendrite pair (spine 3 and dendrite), and the position of the theta-glass stimulation electrode (asterisk). Right, Single-pulse stimulation (arrow) evokes successes (red) and failures (black) in spine 1, but no Ca signals in nearby spines or dendrite. B, Average Ca signals in voltage-clamp with minimal-intensity paired-pulse stimulation (arrows) for spine 1 (red) and spine 2 (black) under baseline conditions (left) and after wash-in of 10 μm TBOA (middle). Right, Summary of SDR for single- and paired-pulse stimulation after wash-in of ACSF or TBOA. C, As in B, for high-intensity stimulation. Asterisks indicate significant difference from 100% or between ACSF and TBOA (p < 0.05).
Figure 9.
Figure 9.
Glutamate spillover promotes NMDA spikes. A, Average EPSPs (left) and Ca signals in spines (middle) and dendrites (right) in response to suprathreshold intensity, paired-pulse stimulation (arrows) under baseline conditions (red) and after wash-in of 10 μm TBOA (black). B, As in A, for subthreshold intensity stimulation. C, Average EPSPs (left) and Ca signals in spines (middle) and dendrites (right) in response to suprathreshold intensity, paired-pulse stimulation under baseline conditions (red), after wash-in of 10 μm NBQX (black) and subsequent wash-in of 10 μm TBOA (blue). D, Summary of impact of TBOA on EPSP amplitude (left), half-width (middle), and Ca signals (right) in spines (open) and dendrites (hash). Asterisks indicate significant difference from 100%.

Comment in

Similar articles

Cited by

References

    1. Acker CD, Antic SD. Quantitative assessment of the distributions of membrane conductances involved in action potential backpropagation along basal dendrites. J Neurophysiol. 2009;101:1524–1541. - PMC - PubMed
    1. Araya R, Nikolenko V, Eisenthal KB, Yuste R. Sodium channels amplify spine potentials. Proc Natl Acad Sci U S A. 2007;104:12347–12352. - PMC - PubMed
    1. Arnth-Jensen N, Jabaudon D, Scanziani M. Cooperation between independent hippocampal synapses is controlled by glutamate uptake. Nat Neurosci. 2002;5:325–331. - PubMed
    1. Asztely F, Erdemli G, Kullmann DM. Extrasynaptic glutamate spillover in the hippocampus: dependence on temperature and the role of active glutamate uptake. Neuron. 1997;18:281–293. - PubMed
    1. Barbour B, Häusser M. Intersynaptic diffusion of neurotransmitter. Trends Neurosci. 1997;20:377–384. - PubMed

Publication types

MeSH terms

LinkOut - more resources