. 2011 Nov;7(11):e1002258.
doi: 10.1371/journal.pcbi.1002258. Epub 2011 Nov 3.

Interspecies translation of disease networks increases robustness and predictive accuracy

Affiliations

Interspecies translation of disease networks increases robustness and predictive accuracy

Seyed Yahya Anvar et al. PLoS Comput Biol. 2011 Nov.

Erratum in

Abstract

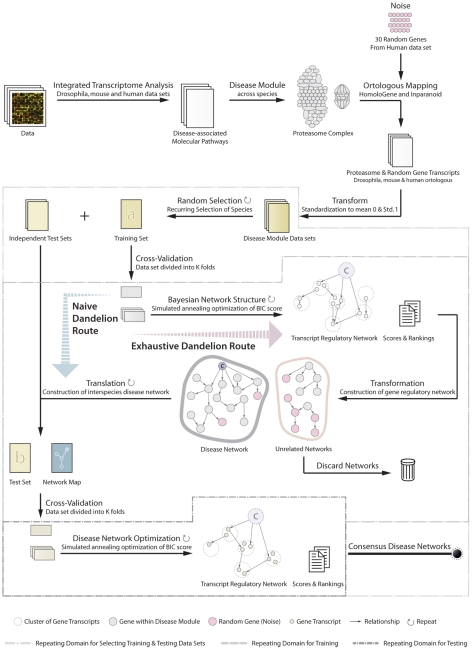
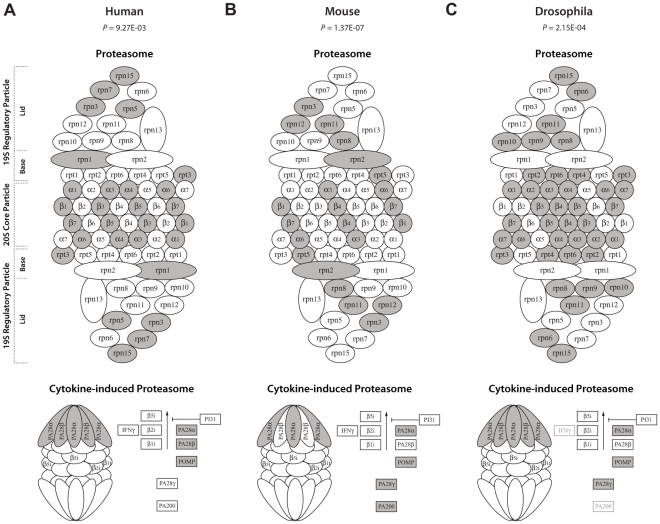
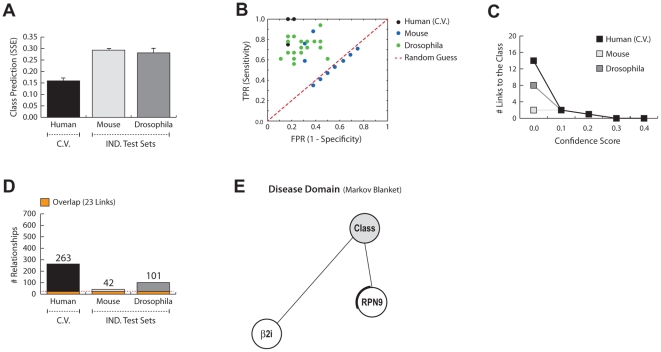
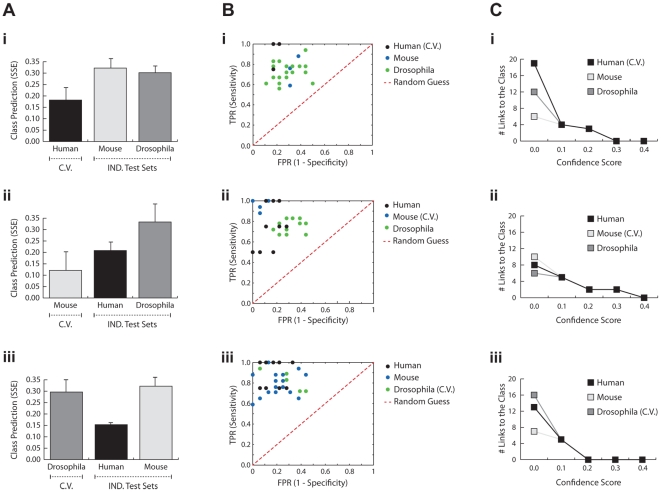
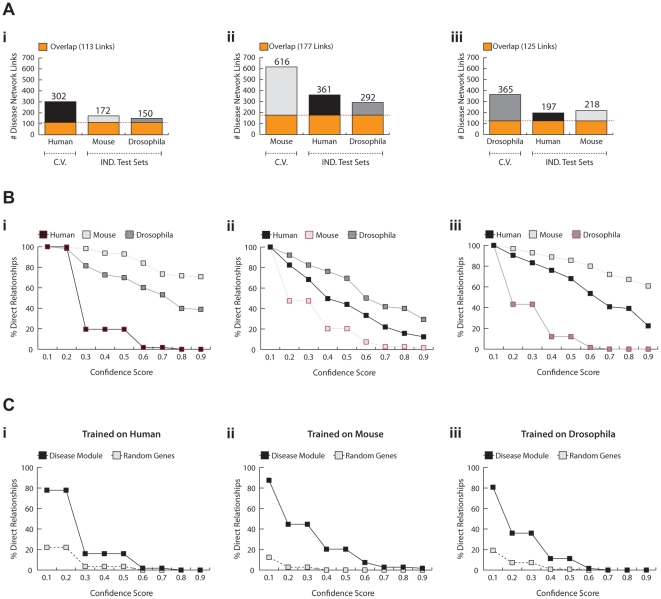
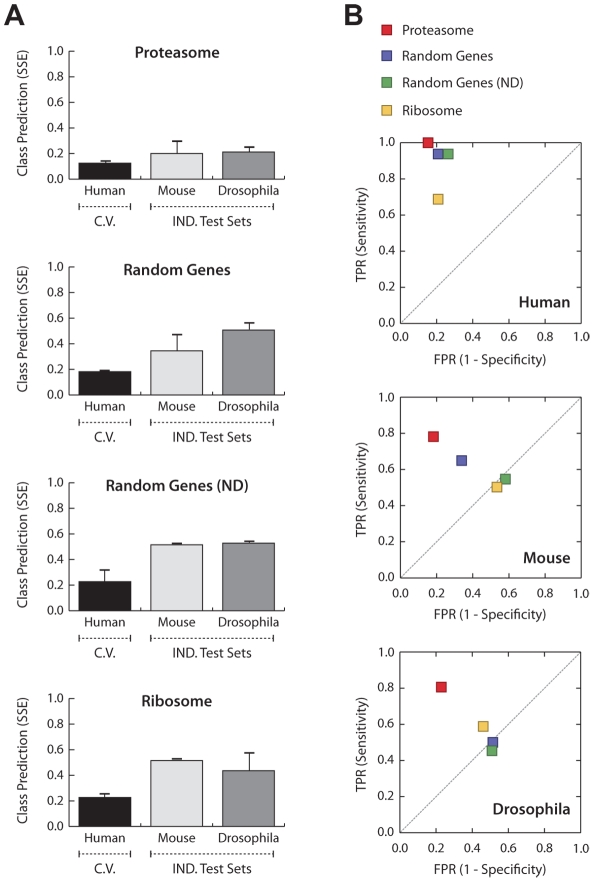
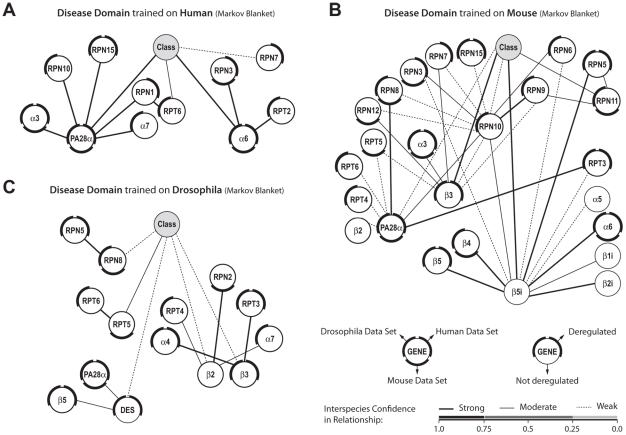
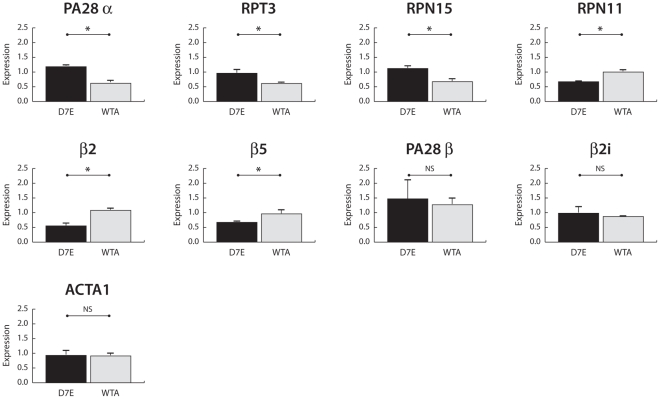
Gene regulatory networks give important insights into the mechanisms underlying physiology and pathophysiology. The derivation of gene regulatory networks from high-throughput expression data via machine learning strategies is problematic as the reliability of these models is often compromised by limited and highly variable samples, heterogeneity in transcript isoforms, noise, and other artifacts. Here, we develop a novel algorithm, dubbed Dandelion, in which we construct and train intraspecies Bayesian networks that are translated and assessed on independent test sets from other species in a reiterative procedure. The interspecies disease networks are subjected to multi-layers of analysis and evaluation, leading to the identification of the most consistent relationships within the network structure. In this study, we demonstrate the performance of our algorithms on datasets from animal models of oculopharyngeal muscular dystrophy (OPMD) and patient materials. We show that the interspecies network of genes coding for the proteasome provide highly accurate predictions on gene expression levels and disease phenotype. Moreover, the cross-species translation increases the stability and robustness of these networks. Unlike existing modeling approaches, our algorithms do not require assumptions on notoriously difficult one-to-one mapping of protein orthologues or alternative transcripts and can deal with missing data. We show that the identified key components of the OPMD disease network can be confirmed in an unseen and independent disease model. This study presents a state-of-the-art strategy in constructing interspecies disease networks that provide crucial information on regulatory relationships among genes, leading to better understanding of the disease molecular mechanisms.


Conflict of interest statement

The authors have declared that no competing interests exist.

Figures

Figure 1
Figure 1. Schematic overview of the Dandelion algorithm for disease network analysis.
The Dandelion algorithm involves three recurring stages of training and independent testing regime with the use of multiple datasets derived from different species. In the first step, disease modules are defined as the most consistently disease-associated molecular pathway across species. The disease module is supplemented by a set of randomly selected genes to assess the performance of the algorithm and to check for overfitting. These datasets are standardized to mean 0 and standard deviation of 1 across genes. The next step involves reiterative selection of one species as an organism in which the gene regulatory network is constructed while others are left aside for independent testing and validation of learnt disease networks. For an intraspecies construction of disease network, dataset is divided into k-folds, using cross-validation, and regulatory relationships between gene transcripts are learnt using Bayesian network methodology enhanced by simulated annealing optimization of network BIC score. After applying confidence thresholds on relationship between genes, the disease network can then be translated to the expected interspecies disease network which we call a network map. Using the cross-validation and network optimization procedure the algorithm searches through the relationships found in the training dataset to find the best fit for interspecies representation of the disease network. These networks are then integrated by removing all the links with low confidence score across species.
Figure 2
Figure 2. OPMD-deregulation across different subunits of the proteasome in different species.
There are widespread differences in gene expression (depicted in dark colors) between OPMD and control in the different functional subunits of proteasome and immunoproteasome in human (A), mouse (B) and Drosophila (C). The Significance of the association between the disease outcome and expression profiles of genes encoding for proteasome and immunoproteasome were previously calculated using the global test .
Figure 3
Figure 3. Performance of the naïve Dandelion algorithm on constructing disease networks that are learnt on human and evaluated on human, mouse and Drosophila datasets.
A) The average Sum of Squared Error (SSE) for prediction of the disease phenotype (OPMD vs. control) given the gene expression profiles within the disease networks learnt on human. The cross-validation set which is used during the training phase is depicted by C.V. and the independent test sets are grouped as IND. Test Sets. B) ROC space demonstrates the relative sensitivity and specificity of the generated networks in predicting the disease phenotype. The results from random expectations are illustrated by the red dash-line. C) Number of relationships between genes and the class node, after applying confidence thresholds, are depicted in line per species. D) The number of links found after interspecies translation and optimization of the disease networks within each species. The orange section, separated by red dash-line, represents the number of links that can be found in all species with the confidence threshold of 0.1. E) The interspecies disease domain is generated according to the Markov blanket criteria, after applying the confidence threshold of 0.1.
Figure 4
Figure 4. Performance of the exhaustive Dandelion algorithm.
A) The average Sum of Squared Error (SSE) for prediction of the disease phenotype (OPMD vs. control) given the gene expression profiles within the disease networks learnt on human (i), mouse (ii), or Drosophila (iii). The cross-validation set which is used during the training phase is depicted by C.V. and the independent test sets are grouped as IND. Test Sets. B) ROC space demonstrates the relative sensitivity and specificity of the generated networks in predicting the disease phenotype. The results from random expectations are illustrated by the red dash-line. C) Number of relationships between genes and the class node, after applying confidence thresholds, are depicted in line per species.
Figure 5
Figure 5. Translatability and robustness of interspecies disease networks.
A) The number of links that were found during interspecies translation and optimization of the disease networks per individual datasets. The red dash-line depicts the number and fraction of links that can be found in all species with the confidence threshold of 0.1. The translatability of disease networks learnt and trained on human (i), mouse (ii), and Drosophila (iii) are presented separately. The cross-validation set which is used during the training phase is depicted by C.V. and the independent test sets are grouped as IND. Test Sets. B) The translatability of relationships over series of different confidence thresholds. These line plots demonstrate the percentage of relationships with confidence score higher than the threshold. For the independent testing datasets the ratio is towards the number of links that were expected to be found after generation of the network map. C) The robustness of disease networks are assessed according to the level of connectivity for genes encoding for the proteasome as compared to the set of randomly selected genes at different confidence thresholds.
Figure 6
Figure 6. Specificity of the proteasome towards prediction of disease states.
A) The average Sum of Squared Error (SSE) for prediction of the disease phenotype (OPMD vs. control) given the gene expression profiles within the constructed networks learnt on the proteasome, 100 random genes, 70 not-deregulated random genes (ND), and the ribosome. The cross-validation set which is used during the training phase is depicted by C.V. and the independent test sets are grouped as IND. Test Sets. B) ROC space demonstrates the relative sensitivity and specificity of the generated networks in predicting the disease phenotype. The proteasome, 100 random genes, 70 random genes (ND), and ribosome are illustrated in different colors (red, purple, green, and yellow, respectively). The results from random expectations are illustrated by the gray dash-line.
Figure 7
Figure 7. Interspecies disease domains.
These interspecies class network structures are learnt on human (A), mouse (B), or Drosophila (C) dataset and optimized across species. Class network structures are presented according to Markov blanket criteria. Nodes represent genes. The outer ring reflects deregulation in the expression in the different species (a, b). Relationships are depicted with lines that represent different degree of confidence in relationships (described in c).
Figure 8
Figure 8. Validation of differential expression of disease associated genes in an unseen disease model.
Results from qPCR experiments measuring differences in gene expression between control cells (WTA, N = 3 independent cultures) and cells expressing the OPMD-associated PABPN1 with expanded repeat (D7E, N = 3 independent cultures). Expression levels were normalized to Desmin to correct for differences in the myogenicity in the different cell cultures. Significant differences (P<0.05, Student's T-test) between measured expression values in D7E and WTA cells are indicated by *, whilst NS stands for no significant difference. PA28α, RPT3, RPN15, RPN11, β2, and β5 expression in IM2 cell lines were selected from the group of genes present in the interspecies disease domain. PA28β (deregulated in human dataset) was selected as its role in assembling the lid subunit of the immunoproteasome is highly similar to PA28α but not part of the interspecies disease domain. β2i is one of the two genes that remained connected to the class node in the interspecies disease domain constructed by naïve Dandelion approach. ACTA1 is a control for myotube formation.

References

    1. Schadt EE. Molecular networks as sensors and drivers of common human diseases. Nature. 2009;461:218–223. doi: 10.1038/nature08454. - DOI - PubMed
    1. Goldstein DB. Common genetic variation and human traits. N Engl J Med. 2009;360:1696–1698. doi: 10.1056/NEJMp0806284. - DOI - PubMed
    1. Karlebach G, Shamir R. Modelling and analysis of gene regulatory networks. Nat Rev Mol Cell Biol. 2008;9:770–780. doi: 10.1038/nrm2503. - DOI - PubMed
    1. Barabasi AL, Gulbahce N, Loscalzo J. Network medicine: a network-based approach to human disease. Nat Rev Genet. 2011;12:56–68. doi: 10.1038/nrg2918. - DOI - PMC - PubMed
    1. Raj A, van Oudenaarden A. Nature, nurture, or chance: stochastic gene expression and its consequences. Cell. 2008;135:216–226. doi: 10.1016/j.cell.2008.09.050. - DOI - PMC - PubMed

Publication types