. 2011 Nov;7(11):e1002342.
doi: 10.1371/journal.ppat.1002342. Epub 2011 Nov 3.

Sequence-based analysis uncovers an abundance of non-coding RNA in the total transcriptome of Mycobacterium tuberculosis

Affiliations

Sequence-based analysis uncovers an abundance of non-coding RNA in the total transcriptome of Mycobacterium tuberculosis

Kristine B Arnvig et al. PLoS Pathog. 2011 Nov.

Abstract

RNA sequencing provides a new perspective on the genome of Mycobacterium tuberculosis by revealing an extensive presence of non-coding RNA, including long 5' and 3' untranslated regions, antisense transcripts, and intergenic small RNA (sRNA) molecules. More than a quarter of all sequence reads mapping outside of ribosomal RNA genes represent non-coding RNA, and the density of reads mapping to intergenic regions was more than two-fold higher than that mapping to annotated coding sequences. Selected sRNAs were found at increased abundance in stationary phase cultures and accumulated to remarkably high levels in the lungs of chronically infected mice, indicating a potential contribution to pathogenesis. The ability of tubercle bacilli to adapt to changing environments within the host is critical to their ability to cause disease and to persist during drug treatment; it is likely that novel post-transcriptional regulatory networks will play an important role in these adaptive responses.


Conflict of interest statement

The authors have declared that no competing interests exist.

Figures

Figure 1
Figure 1. Representation of functional classes in the M. tuberculosis transcriptome.
Transcripts identified by sequence analysis were grouped according to the functional class of their predicted gene product as assigned in the original genome annotation . For all panels, values on the x-axis represents a difference in percentage, positive values indicate over-representation of a particular functional class whereas negative values indicate under-representation. Panel A shows the difference in the percentage of the functional classes among the 10% highest expressed genes of the transcriptome (N = 400) when compare to the percentage observed in the annotated genome. Panel B shows the difference in percentage of selected functional classes when comparing the transcripts with abundant antisense levels (antisense to sense ratio >0.5, N = 435) with the total set of CDSs with RPKM ≥5 (N = 3,136). Panel C shows the difference in percentage for selected functional classes when comparing the transcripts with abundant 5’ UTRs (see text for details, N = 82) with the total set of CDSs with RPKM ≥5 (N = 3,136). For B and C, no significant differences in representation were observed for functional classes that are not shown. * p<0.05 using Fisher's exact test. ** significant after multiple test correction (False Discovery Rate method).
Figure 2
Figure 2. Antisense transcripts arising from 3’ UTRs.
Examples of transcription profiles vizualised using the Artemis genome browser. Blue and red traces show transcription in the forward and reverse direction respectively. The x-axis records the position on the genome, and the y-axis records the number of reads mapped at that location; the maximum expression is shown on the y-axis. Examples illustrate 3’ UTR profiles that tail off into the adjacent gene (panel A) or rise to a peak in the overlap region (panel B). A. Rv0653c (a predicted transcriptional regulator) is covered by an antisense transcript extending from the 3’ end of the rplJ-rplL ribosomal protein operon in exponential phase, but not in stationary phase. B. The 3’ end of Rv3377c (a putative cyclase gene) is covered by an antisense transcript from the converging gene Rv3776. Again the antisense overlap is present only in the exponential phase.
Figure 3
Figure 3. Antisense transcripts independent of 3’ UTRs.
Artemis profiles are shown for antisense transcripts that cover the middle (A) or either end of a gene (C, D), or that cover the entire CDS (E). Panels B and F illustrate further characterization of the ino1 (Rv0046, inositol-1-phosphate synthase) and Rv1374c antisense transcripts by Northern blotting.
Figure 4
Figure 4. 5’ UTRs of heat shock chaperones.
Transcription of groEL2 (panel A) and groES (panel B) is associated with long 5’-leader sequences that include the CIRCE motifs involved in heat shock regulation. Arrows indicate the putative transcription start sites based on signal start and increase in slope, respectively, suggesting that there are CIRCE-dependent and CIRCE-independent transcription start sites for these genes. Genome locations are indicated below and maximum expression in exponential and stationary phases are shown on the y-axis.
Figure 5
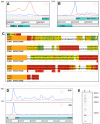
Figure 5. 5’ UTRs from genes involved in transcription and translation.
Panels A and B show Artemis profiles of the 5’ UTRs of the infA and infC genes encoding translation initiation factors. Panel C is a T-coffee consensus alignment of these two 5’ UTRs generated using the WAR webserver (http://genome.ku.dk/resources/war) . The alignment is based on the consensus from four independent alignment approaches, and shows significant homology in several regions (key to the degree of alignment is shown in the top left corner of the panel). The 5’ UTR homologies are consistent with a common recognition site involved in coordinate regulation. Panels D and E illustrate analysis of the 5’ UTR of rpoB by Artemis profiling and Northern blotting of samples from exponential (“e”) and stationary (‘s”) growth phases. The 5’ UTR of rpoB remains prominent in stationary phase, in contrast to decreased expression of the CDS.
Figure 6
Figure 6. Rv1535 is flanked by two riboswitches.
The region between Rv1534 and Rv1536 (ileS, isoleucyl-tRNA synthase) is predicted to contain two riboswitches; an Mbox upstream of Rv1535 and a T-box upstream of ileS. The intervening open reading frame, Rv1535, is annotated as expressing a hypothetical protein with unidentified homology or function. Panel A shows Artemis expression profiles and panel B illustrates Northern blot analysis in exponential (“e”) and growth stationary phase (“s”), using the probe indicated by a black bar above the Mbox. Riboswitch expression is evident in the form of short RNA transcripts with a more downstream start site in stationary phase.
Figure 7
Figure 7. Intergenic sRNAs.
Transcription profiles and Northern blots showing the expression of M. tuberculosis sRNAs in exponential and stationary phase.A and B. MTS2823 is the most abundant sRNA during exponential growth (“e”), with a further increase seen in stationary phase (“s”). C and D. MTS0997 is readily detectable by RNA-seq and by Northern blot during exponential growth, with a significant increase in stationary phase. Expression of MTS0997 was reduced in both growth phases in a strain of M. tuberculosis lacking the cAMP receptor protein (CRP). E and F. MTS1338 is barely detectable during exponential growth, but is strongly induced in stationary phase. The sRNA transcript partially overlaps Rv1734c, which is oriented in the reverse direction to MTS1338 and annotated as encoding a hypothetical protein. Deletion of the DosR two-component regulator markedly reduces, but does not entirely eliminate stationary phase expression of MTS1338.
Figure 8
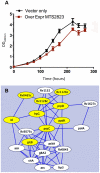
Figure 8. Over-expression of MTS2823.
Panel A shows in vitro growth curves for M. tuberculosis H37Rv over-expressing MTS2823 compared to M. tuberculosis H37Rv harbouring the empty vector. Panel B: Hypothetical protein association network centered around prpC. The figure was created using the STRING database . Proteins are shown as nodes and associations as lines. The methyl citrate genes prpC, prpD and their regulator, lrpG, are shown along with their immediate first neighbours; genes down-regulated between 2- and 2.5-fold are shown in white and genes down-regulated 2.5-fold or more are shown in yellow. Network construction and visualisation was performed in Cytoscape .
Figure 9
Figure 9. Accumulation of sRNAs during infection.
Quantitative RT-PCR confirmed the findings from sequence analysis and Northern blotting that the abundance of MTS0997, MTS1338 and MTS2823 is markedly increased in stationary phase cultures in contrast to the reduction in groES mRNA. Analysis of M. tuberculosis RNA from the lungs of chronically infected mice showed a further increase in the amount of each of the sRNAs relative to 16S rRNA control.

References

    1. WHO . Geneva: WHO; 2009. Global tuberculosis control - epidemiology, strategy, financing.
    1. Barry CE, 3rd, Boshoff HI, Dartois V, Dick T, Ehrt S, et al. The spectrum of latent tuberculosis: rethinking the biology and intervention strategies. Nat Rev Microbiol. 2009;7:845–855. - PMC - PubMed
    1. Reddy TB, Riley R, Wymore F, Montgomery P, DeCaprio D, et al. TB database: an integrated platform for tuberculosis research. Nucleic Acids Res. 2009;37:D499–508. - PMC - PubMed
    1. Manganelli R, Voskuil MI Schoolnik GK, Dubnau E, Gomez M, et al. Role of the extracytoplasmic-function sigma factor sigma(H) in Mycobacterium tuberculosis global gene expression. Mol Microbiol. 2002;45:365–374. - PubMed
    1. Park HD, Guinn KM, Harrell MI, Liao R, Voskuil MI, et al. Rv3133c/dosR is a transcription factor that mediates the hypoxic response of Mycobacterium tuberculosis. Mol Microbiol. 2003;48:833–843. - PMC - PubMed

Publication types