. 2011;6(11):e25866.
doi: 10.1371/journal.pone.0025866. Epub 2011 Nov 2.

Differentiation between vergence and saccadic functional activity within the human frontal eye fields and midbrain revealed through fMRI

Affiliations

Differentiation between vergence and saccadic functional activity within the human frontal eye fields and midbrain revealed through fMRI

Yelda Alkan et al. PLoS One. 2011.

Abstract

Purpose: Eye movement research has traditionally studied solely saccade and/or vergence eye movements by isolating these systems within a laboratory setting. While the neural correlates of saccadic eye movements are established, few studies have quantified the functional activity of vergence eye movements using fMRI. This study mapped the neural substrates of vergence eye movements and compared them to saccades to elucidate the spatial commonality and differentiation between these systems.

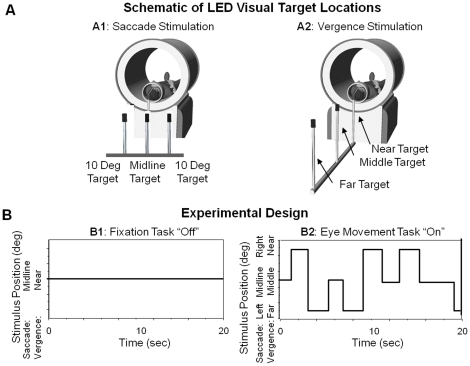
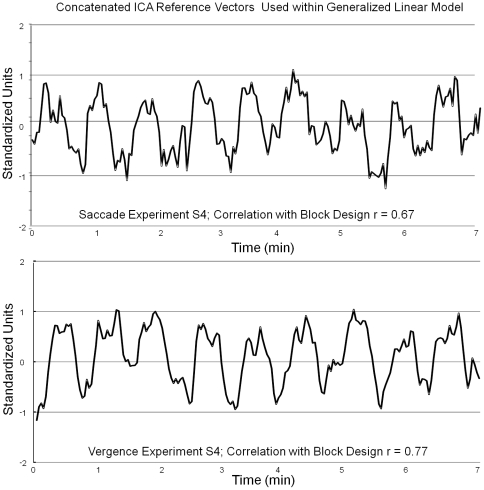
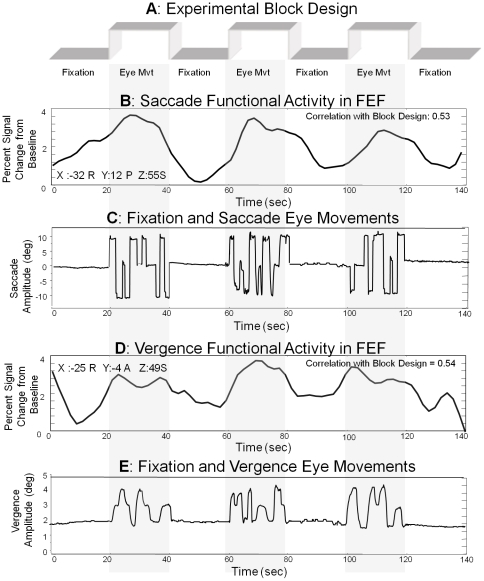
Methodology: The stimulus was presented in a block design where the 'off' stimulus was a sustained fixation and the 'on' stimulus was random vergence or saccadic eye movements. Data were collected with a 3T scanner. A general linear model (GLM) was used in conjunction with cluster size to determine significantly active regions. A paired t-test of the GLM beta weight coefficients was computed between the saccade and vergence functional activities to test the hypothesis that vergence and saccadic stimulation would have spatial differentiation in addition to shared neural substrates.

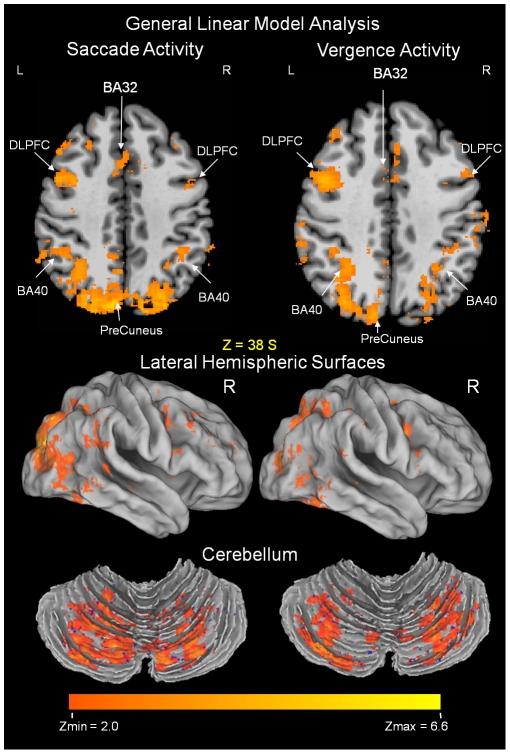
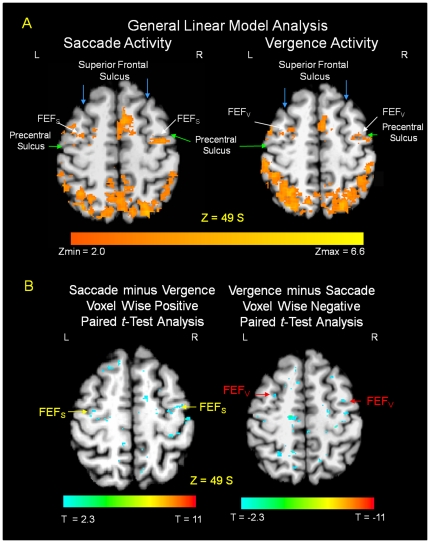
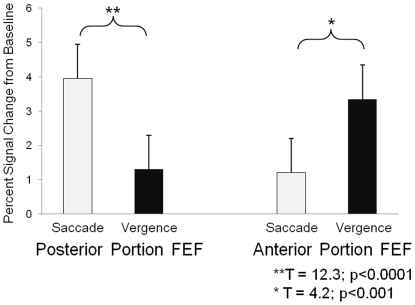
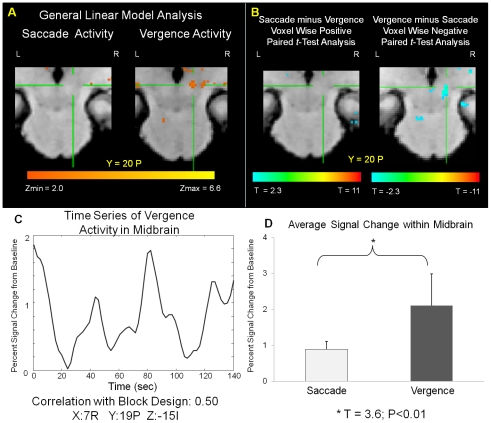
Results: Segregated functional activation was observed within the frontal eye fields where a portion of the functional activity from the vergence task was located anterior to the saccadic functional activity (z>2.3; p<0.03). An area within the midbrain was significantly correlated with the experimental design for the vergence but not the saccade data set. Similar functional activation was observed within the following regions of interest: the supplementary eye field, dorsolateral prefrontal cortex, ventral lateral prefrontal cortex, lateral intraparietal area, cuneus, precuneus, anterior and posterior cingulates, and cerebellar vermis. The functional activity from these regions was not different between the vergence and saccade data sets assessed by analyzing the beta weights of the paired t-test (p>0.2).

Conclusion: Functional MRI can elucidate the differences between the vergence and saccade neural substrates within the frontal eye fields and midbrain.


Conflict of interest statement

Competing Interests: The authors have declared that no competing interests exist.

Figures

Figure 1
Figure 1. Experimental set-up and design.
The schematic of the custom fMRI compatible light emitting diodes (LEDs) for the saccade (image A1) and vergence (image A2) experiments. Subjects would sustain fixation (plot B1) on either the midline target during the saccade experiment or near target during the vergence experiment for 20 seconds and then track the illuminated LEDs in a random pattern for 20 seconds (plot B2). A block design protocol is used where the “off’ stimulus is sustained fixation and the “on” stimulus is the random eye movement tracking.
Figure 2
Figure 2. Typical reference vectors from one subject (S4) from the saccadic data set (upper plot) and the vergence data set (lower plot).
The source signals have a high Pearson correlation coefficient with the experimental block design (r = 0.67 for the saccade experiment and r = 0.77 for the vergence experiment).
Figure 3
Figure 3. Experimental block design of 3.5 cycles alternating between fixation and eye movements (Plot A).
Fixation and saccadic eye movements to targets 10 degrees into the left or right visual field or along midline plotted as position (deg) as a function of time (sec) (Plot B). Functional activity within FEF during saccadic stimulation plotted as percent signal change from baseline as a function of time (sec) (Plot C). Fixation and vergence eye movements to targets 2, 3, or 4 degrees along midline plotted as position (deg) as a function of time (sec) (Plot D). Functional activity within FEF during vergence stimulation plotted as percent signal change from baseline as a function of time (sec) (Plot E).
Figure 4
Figure 4. Functional activation for the group analysis of fixation versus random eye movements for the saccade (left side) and the vergence data set (right side) showing typical commonality.
DLPFC = dorsolateral prefrontal cortex and BA = Brodmann Area. The number of mm above the bicommissural plane is indicated. The functional activation is denoted by the scale bar as a z-score from a minimum of 2.0 to a maximum value of 6.6. Data are overlaid onto a standardized Talairach-Tournoux normalized image. Semi-inflated images of the functional activity within the lateral hemispheric surface and cerebellum are displayed using Caret software.
Figure 5
Figure 5. Axial images showing differentiation between the functional activity of the frontal eye fields (FEF) from saccade (left) and vergence (right) eye movements.
Functional activity using the GLM analysis is shown in Figure 5A. The voxel wise positive and negative paired t-tests show significant differentiation between FEF for vergence and saccades, Figure 5B. The GLM analysis reports activity using the scale bar of a z-score from 2.0 to 6.6. The paired t-tests using the beta weights from the GLM analysis reports significant differences from T = ±2.3 to ±11 (two-tailed p-value = 0.05 to p<0.0001). Functional activity and paired t-test significant differences are overlaid onto Talairach-Tournoux normalized axial structural images. The axial slice is 49 mm superior to the bicommissural plane for all images. L: left; R: right. The superior frontal sulcus is denoted with blue arrows and the precentral sulcus is denoted with green arrows in Figure 5A. The significant differences within FEF are denoted with red arrows for vergence (FEFv) and yellow arrows for saccades (FEFs) in Figure 5B.
Figure 6
Figure 6. Percent signal change from baseline within the posterior (left) and anterior (right) portions of the frontal eye fields (FEF).
Significantly more signal change is observed within the posterior portion of FEF in the saccade compared to the vergence data set. Significantly more signal changes is observed within the anterior portion of FEF in the vergence compared to the saccade data set.
Figure 7
Figure 7. Functional activity within the midbrain using a GLM analysis (Plot A).
Positive and negative paired t-test statistical spatial map showing differentiation between the midbrain for the fixation versus random saccadic and vergence tasks identified via the cross hair. A positive T value is for the saccade minus vergence data set and a negative T value is for the vergence minus saccade data set (Plot B). Typical time series signal from the midbrain which has a correlation of 0.5 with the block design (square wave) (Plot C). Talairach Tournoux coordinates are: 7 R, 19 P and 15 I. Comparison of the percent signal change from baseline of the same time series signals from the saccade and vergence data sets within the midbrain (Plot D).

References

    1. Leigh RJ, Zee DS. The Neurology of Eye Movements; In: Gilman S, editor. Oxford: Oxford University Press; 2006. 763 p.
    1. Bababekova Y, Rosenfield M, Hue JE, Huang RR. Font size and viewing distance of handheld smart phones. Optom Vis Sci. 2011;88:795–797. - PubMed
    1. Hoffman DM, Girshick AR, Akeley K, Banks MS. Vergence-accommodation conflicts hinder visual performance and cause visual fatigue. J Vis. 2008;8:33 31–30. - PMC - PubMed
    1. Howarth PA. Potential hazards of viewing 3-D stereoscopic television, cinema and computer games: a review. Ophthalmic Physiol Opt. 2011;31:111–122. - PubMed
    1. Semmlow JL, Yuan W, Alvarez TL. Short-term Adaptive Control Processes in Vergence Eye Movement. Current Psychology of Cognition. 2002;21:343–375.

Publication types