. 2011;6(11):e26781.
doi: 10.1371/journal.pone.0026781. Epub 2011 Nov 2.

NNAlign: a web-based prediction method allowing non-expert end-user discovery of sequence motifs in quantitative peptide data

Affiliations

NNAlign: a web-based prediction method allowing non-expert end-user discovery of sequence motifs in quantitative peptide data

Massimo Andreatta et al. PLoS One. 2011.

Abstract

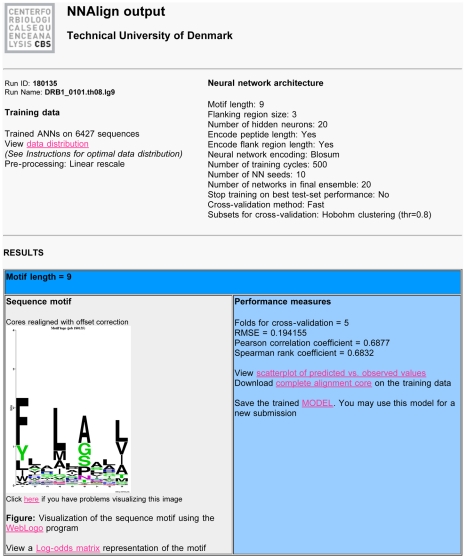
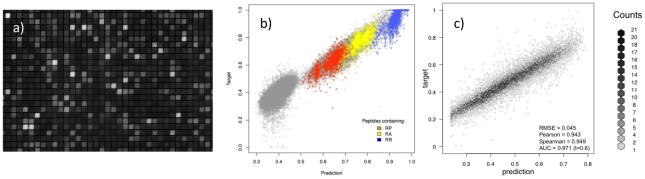
Recent advances in high-throughput technologies have made it possible to generate both gene and protein sequence data at an unprecedented rate and scale thereby enabling entirely new "omics"-based approaches towards the analysis of complex biological processes. However, the amount and complexity of data that even a single experiment can produce seriously challenges researchers with limited bioinformatics expertise, who need to handle, analyze and interpret the data before it can be understood in a biological context. Thus, there is an unmet need for tools allowing non-bioinformatics users to interpret large data sets. We have recently developed a method, NNAlign, which is generally applicable to any biological problem where quantitative peptide data is available. This method efficiently identifies underlying sequence patterns by simultaneously aligning peptide sequences and identifying motifs associated with quantitative readouts. Here, we provide a web-based implementation of NNAlign allowing non-expert end-users to submit their data (optionally adjusting method parameters), and in return receive a trained method (including a visual representation of the identified motif) that subsequently can be used as prediction method and applied to unknown proteins/peptides. We have successfully applied this method to several different data sets including peptide microarray-derived sets containing more than 100,000 data points. NNAlign is available online at http://www.cbs.dtu.dk/services/NNAlign.


Conflict of interest statement

Competing Interests: C Schafer-Nielsen is employed by the company Schafer-N, which generated some of the data used in this study. There are no patents, products in development or marketed products to declare. This does not alter the authors' adherence to all the PLoS ONE policies on sharing data and materials, as detailed online in the guide for authors.

Figures

Figure 1
Figure 1. Example of output from the NNAlign server trained on MHC class II binding data for allele HLA-DRB1*0101.
Links on the results page (in pink) redirect to additional files and figures relevant for the analysis. Run ID is a sequential identifier for the current job, and Run Name a user-defined prefix that is added to all files of the run. The “view data distribution” link shows the transformation applied to the data in pre-processing, which can be either a linear or logarithmic transformation. In this case the method was trained with a motif length of 9, including a PFR of size 3 to both ends of the peptide, and encoding in the network input layer peptide length and PFR length. The hidden layer was made of a fixed number of 20 neurons. Peptides were presented to the networks using a Blosum encoding to account for amino acid similarity, for 500 hundred iterations per peptide without stopping on the best test set performance. At each cross-validation step, 10 networks were trained starting from 10 different initial configurations. The subsets for cross-validation were constructed using a Hobohm1 method that groups in the same subset sequences that align with more than 80% identity (thr = 0.8). The model can be downloaded to disk using the dedicated link, and can be resubmitted to NNAlign to find occurrences of the learned pattern in new data. The estimated performance of the trained method is expressed in terms of Root Mean Square Error, Pearson and Spearman correlation. A visual representation of the correlation can be obtained from the scatterplot of predicted versus observed values. The “complete alignment core” link allows downloading the prediction values in cross-validation for each peptide, and where the core was placed within the peptides. Next follows a section on the sequence logo, showing a logo representation of the binding motif learned by the network ensemble. If the relative option is selected, links to logos for the individual networks in the final ensemble are also listed here. Finally, if an evaluation set is uploaded, an additional section shows performance measures and core alignment for these data.
Figure 2
Figure 2. Identification of optimal motif length using the NNAlign method.
Left panel: Histogram of the optimal motifs lengths for the 14 HLA-DR molecules in the Wang dataset as identified by the NNAlign method. Right panel: Predictive performance measured in terms of the root mean square error (RMSE) between observed and predicted values as a function of the motif length for the two molecules DRB1*0101 and DRB1*1501. NNAlign was trained using the same parameters settings described in Figure 4. At each motif length are shown the mean and standard error of the mean RMSE as estimated by bootstrap sampling. For DRB1*0101 a single consistent optimal motif length of 9 amino acids is found. For DRB1*1501 all motif length 8–11 had statistically indistinguishable performance (paired t-test).
Figure 3
Figure 3. Sequence logos for HLA*DRB1-0401.
In panels a) to d) are shown sequence logos for 4 single networks from the network ensemble created with NNAlign. The fundamental pattern appears in all these networks, but they place the anchors at different position of the core. e) shows the core of the 20 networks ensemble without offset correction; in f) offset correction was used to realign the logos to a common register.
Figure 4
Figure 4. Sequence logo representation of the binding motifs for the 14 HLA-DR molecules contained in the Wang MHC class II data set.
NNAlign was trained with Blosum encoding, including peptide length and flanking region length, PFRs of 3 amino acids, homology clustering at threshold 0.8 using all data points, 20 hidden neurons and a 5-fold cross-validation without stopping on the best test set performance.. Sequence logos are calculated as described in material and methods and visualized using the WebLogo program .
Figure 5
Figure 5. Analysing high-density peptide array data with NNAlign.
a) Fluorescence microscopy picture of a peptide microarray. The image is a magnified segment of the peptide chip used in the trypsin cleavage analysis. b) Trypsin peptide-chip data. The normalized observed (target) likelihood of cleavage as a function of the prediction score for the trypsin data set. Localizations of peptides containing the pairs of amino acids RP, RA or RR are highlighted in the plot. Proline (P) is known to prevent cleavage after arginine (R), whereas cleavage is observed with other amino acids such as R and A. c) Chymotrypsin peptide-chip data. Correlation plot between predicted and measured (target) data from the chymotrypsin data set. Values are binned by their x,y proximity, so that the scatterplot represents the density of data in each bin. NNAlign was trained with linear rescaling of the quantitative data, a motif length of 4 amino acids without inclusion of PFR encoding, Blosum encoding of peptide sequences, a combination of 3,7,15 hidden neurons, 10 initial seeds, 5-fold exhaustive cross-validation, training was stopped on the best test set performance.

Similar articles

Cited by

References

    1. James W. Nucleic acid and polypeptide aptamers: a powerful approach to ligand discovery. Curr Opin Pharmacol. 2001;1:540–546. - PubMed
    1. Hoppe-Seyler F, Crnkovic-Mertens I, Tomai E, Butz K. Peptide aptamers: specific inhibitors of protein function. Curr Mol Med. 2004;4:529–538. - PubMed
    1. Lin J, Bardina L, Shreffler WG, Andreae DA, Ge Y, et al. Development of a novel peptide microarray for large-scale epitope mapping of food allergens. J Allergy Clin Immunol. 2009;124:315–322, 322 e311–313. - PMC - PubMed
    1. Schutkowski M, Reineke U, Reimer U. Peptide arrays for kinase profiling. Chembiochem. 2005;6:513–521. - PubMed
    1. Han X, Yamanouchi G, Mori T, Kang JH, Niidome T, et al. Monitoring protein kinase activity in cell lysates using a high-density peptide microarray. J Biomol Screen. 2009;14:256–262. - PubMed

Publication types