. 2011 Nov 10:10:339.
doi: 10.1186/1475-2875-10-339.

Standardizing the measurement of parasite clearance in falciparum malaria: the parasite clearance estimator

Affiliations

Standardizing the measurement of parasite clearance in falciparum malaria: the parasite clearance estimator

Jennifer A Flegg et al. Malar J. .

Abstract

Background: A significant reduction in parasite clearance rates following artesunate treatment of falciparum malaria, and increased failure rates following artemisinin combination treatments (ACT), signaled emergent artemisinin resistance in Western Cambodia. Accurate measurement of parasite clearance is therefore essential to assess the spread of artemisinin resistance in Plasmodium falciparum. The slope of the log-parasitaemia versus time relationship is considered to be the most robust measure of anti-malarial effect. However, an initial lag phase of numerical instability often precedes a steady exponential decline in the parasite count after the start of anti-malarial treatment. This lag complicates the clearance estimation, introduces observer subjectivity, and may influence the accuracy and consistency of reported results.

Methods: To address this problem, a new approach to modelling clearance of malaria parasites from parasitaemia-time profiles has been explored and validated. The methodology detects when a lag phase is present, selects the most appropriate model (linear, quadratic or cubic) to fit log-transformed parasite data, and calculates estimates of parasite clearance adjusted for this lag phase. Departing from previous approaches, parasite counts below the level of detection are accounted for and not excluded from the calculation.

Results: Data from large clinical studies with frequent parasite counts were examined. The effect of a lag phase on parasite clearance rate estimates is discussed, using individual patient data examples. As part of the World Wide Antimalarial Resistance Network's (WWARN) efforts to make innovative approaches available to the malaria community, an automated informatics tool: the parasite clearance estimator has been developed.

Conclusions: The parasite clearance estimator provides a consistent, reliable and accurate method to estimate the lag phase and malaria parasite clearance rate. It could be used to detect early signs of emerging resistance to artemisinin derivatives and other compounds which affect ring-stage clearance.


Figures
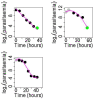
Figure 1
Figure 1
Typical linear, quadratic or cubic-shaped log(parasitaemia)-time profiles (polynomial fit shown in pink line) in falciparum malaria. Black points represent the data, green points represent censored values and red points represent points removed in the cleaning process.
Figure 2
Figure 2
The effect of lag phase and tail exclusion on the calculation of the clearance rate constant.
Figure 3
Figure 3
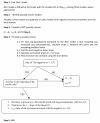
Flow chart showing the models tested during the process of finding the best model representing parasite clearance over time for an individual patient.
Figure 4
Figure 4
Diagrammatic representation of the process of estimating the clearance rate constant (K) and the duration of lag phase (tlag ) from individual patient parasite counts measured over time.
Figure 5
Figure 5
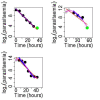
Linear and polynomial fits to the quadratic or cubic -shaped log(parasitaemia)-time profiles shown in Figure 3. Black points represent the data, green points represent censored values and grey points represent points identified as being part of the lag phase. Pink line shows cubic fit to the data, red line shows linear fit the data and blue line shows the linear fit to the identified 'linear part' of the profile.
Figure 6
Figure 6
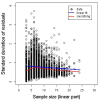
The standard deviation of the residuals versus the sample size of the linear part of the parasite clearance profile.
Figure 7
Figure 7
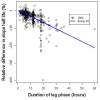
The relative difference in slope half-life rate comparing the final slope half-life to that calculated by fitting a linear model to all the data. (Note that only those profiles for which tlag > 0 were used here, for comparison purposes). Relative difference in slope half-life is calculated as the slope half-life from lag regression minus the slope half-life from linear regression, divided by the slope half-life from lag regression.
Figure 8
Figure 8
The comparison between slope half-life estimated from parasite measurements taken every six and 12 hours in the first two days.
Figure 9
Figure 9
Relative difference in slope half-life estimated from six-hourly and 12-hourly measurements, by sample size. Left panel shows results for profiles with no lag phase identified based on six-hourly measurements; right panel shows results for profiles with lag phase. Sample size is equal to number of measurements at 12-hourly intervals in linear part of profile (after excluding lag phase and tails). Relative difference in slope half-life is calculated as the slope half-life from six-hourly measurements minus the slope half-life from 12-hourly measurements, divided by the slope half-life from six-hourly measurements.
Figure 10
Figure 10
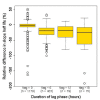
Box-plots of relative difference in slope half-life estimated from six-hourly and 12-hourly measurements, stratified by lag phase (tlag). Relative difference in slope half-life is calculated as the slope half-life from six-hourly measurements minus the slope half-life from 12-hourly measurements, divided by the slope half-life from six-hourly measurements.

References

    1. Guerin P, Olliaro P, Nosten F, Druilhe P, Laxminarayan R, Binka F, Kilama W, Ford N, White N. Malaria: current status of control, diagnosis, treatment, and a proposed agenda for research and development. Lancet Infect Dis. 2002;2:564–573. doi: 10.1016/S1473-3099(02)00372-9. - DOI - PubMed
    1. Ibrahim M, Steenkeste N, Khim N, Adam H, Konaté L, Coppée J, Ariey F, Duchemin J. Field-based evidence of fast and global increase of Plasmodium falciparum drug-resistance by DNA-microarrays and PCR/RFLP in Niger. Malar J. 2009;8:32. doi: 10.1186/1475-2875-8-32. - DOI - PMC - PubMed
    1. World Health Organization. Guidelines for the treatment of malaria, second edition. World Health Organization, Geneva; 2010.
    1. Noedl H, Se Y, Sriwichai S, Schaecher K, Teja-Isavadharm P, Smith B, Rutvisuttinunt W, Bethell D, Surasri S, Fukuda MM. Artemisinin resistance in Cambodia: a clinical trial designed to address an emerging problem in Southeast Asia. Clin Infect Dis. 2010;51:e82. doi: 10.1086/657120. - DOI - PubMed
    1. Dondorp AM, Nosten F, Yi P, Das D, Phyo AP, Tarning J, Lwin KM, Ariey F, Hanpithakpong W, Lee SJ, Ringwald P, Silamut K, Imwong M, Chotivanich K, Lim P, Herdman T, An SS, Yeung S, Singhasivanon P, Day NP, Lindegardh N, Socheat D, White NJ. Artemisinin resistance in Plasmodium falciparum malaria. N Engl J Med. 2009;361:455–467. doi: 10.1056/NEJMoa0808859. - DOI - PMC - PubMed

Publication types

MeSH terms