. 2012 May;166(2):617-36.
doi: 10.1111/j.1476-5381.2011.01780.x.

Gallium compound GaQ(3) -induced Ca(2+) signalling triggers p53-dependent and -independent apoptosis in cancer cells

Affiliations

Gallium compound GaQ(3) -induced Ca(2+) signalling triggers p53-dependent and -independent apoptosis in cancer cells

Rajan Gogna et al. Br J Pharmacol. 2012 May.

Erratum in

  • Br J Pharmacol. 2016 Feb;173(3):627
  • Erratum.
    [No authors listed] [No authors listed] Br J Pharmacol. 2016 Feb;173(3):627. doi: 10.1111/bph.13412. Epub 2016 Jan 27. Br J Pharmacol. 2016. PMID: 31265508 Free PMC article.

Abstract

BACKGROUND AND PURPOSE A novel anti-neoplastic gallium complex GaQ(3) (KP46), earlier developed by us, is currently in phase I clinical trial. GaQ(3) induced S-phase arrest and apoptosis via caspase/PARP cleavage in a variety of cancers. However, the underlying mechanism of apoptosis is unknown. Here, we have explored the mechanism(s) of GaQ(3) -induced apoptosis in cancer cells, focusing on p53 and intracellular Ca(2+) signalling. EXPERIMENTAL APPROACH GaQ(3) -induced cytotoxicity and apoptosis were determined in cancer cell lines, with different p53 status (p53(+/+) , p53(-/-) and p53 mutant). Time course analysis of intracellular Ca(2+) calcium release, p53 promoter activation, p53-nuclear/cytoplasmic movements and reactive oxygen species (ROS) were conducted. Ca(2+) -dependent formation of the p53-p300 transcriptional complex was analysed by co-immunoprecipitation and chromatin immunoprecipitation. Ca(2+) signalling, p53, p300 and ROS were serially knocked down to study Ca(2+) -p53-ROS ineractions in GaQ(3) -induced apoptosis. KEY RESULTS GaQ(3) triggered intracellular Ca(2+) release stabilizing p53-p300 complex and recruited p53 to p53 promoter, leading to p53 mRNA and protein synthesis. p53 induced higher intracellular Ca(2+) release and ROS followed by activation of p53 downstream genes including those for the micro RNA mir34a. In p53(-/-) and p53 mutant cells, GaQ(3) -induced Ca(2+) -signalling generated ROS. ROS further increased membrane translocation of FAS and FAS-mediated extrinsic apoptosis. CONCLUSIONS AND IMPLICATIONS This study disclosed a novel mechanism of Ca(2+) -signalling-mediated p53 activation and ROS up-regulation. Understanding the mechanism of GaQ(3) -induced apoptosis will help establish this gallium-based organic compound as a potent anti-cancer drug.


Figures

Figure 1
Figure 1
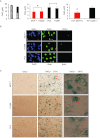
GaQ3 induces cytotoxicity in p53+/+ and p53−/− cells. (A) IC50 values of GaQ3-treated normal keratinocytes and PBMCs are calculated based on MTT and LDH assays. IC50 values of GaQ3 in normal keratinocytes and PBMCs were higher than those in MCF-7, HepG2, PC3 and H1299 cells. In the middle graph, the IC50 values are lower for HepG2 cells and p53+/+ (MCF-7) cells than in p53−/− (H1299) cells and p53 mutant (PC3) cells. In the last graph the IC50 for GaQ3 in HCT-p53+/+ cells was lower than that in HCT-p53−/− cells. Data shown are means ± SD (n= 10), *P < 0.05, significant difference between p53+/+ and p53−/− or p53 mutant cells; anova. (B) Effect of GaQ3 on cellular DNA synthesis determined by BrdU assay in MCF-7, H1299 and PC3 cells. Immunofluorescence microscopy was used to visualize BrdU incorporation in control (second panel) and GaQ3-treated cells (third panel). DAPI was used to stain the nucleus (n= 7). GaQ3 was used for 24 h, at the IC50 corresponding to each cell line. (C) p53+/+ (MCF-7), p53−/− (H1299) and p53 mutant (PC3) cells were treated with GaQ3 at corresponding IC50, for 24 h and assayed for cellular senescence using SA-β Gal assay (10× and 40×, phase contrast; n= 5).
Figure 2
Figure 2
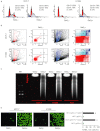
GaQ3 mediated cell cycle arrest and apoptosis in cancer cells. (A) Effects of GaQ3 on cell cycle progression in MCF-7 and H1299 cells using PI staining. GaQ3-treated MCF-7 and H1299 cells show G1–S phase arrest (n= 10). (B) GaQ3-induced apoptosis in MCF-7 and H1299 cells using Annexin V-FITC staining, showing 67% and 51% apoptosis, respectively (n= 15). (C) DNA fragmentation assay in GaQ3-treated MCF-7, H1299 and PC3 cells shows a characteristic DNA ladder indicating GaQ3-induced apoptosis in all three cell lines (n= 3). (D) TUNEL assay using fluorescence microscopy in MCF-7 and H1299 cells (left panel) and using elisa-based assays in HCT-p53+/+ and HCT-p53−/− cells. In both sets of experiments, GaQ3-treated cells were TUNEL positive (n= 8).
Figure 3
Figure 3
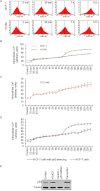
GaQ3 induced intracellular release of Ca2+ in cancer cells. (A) GaQ3-induced intracellular Ca2+ release in MCF-7 and H1299 cells using Fluo-3-AM dye and flow cytometry, determined after 30 min, 7 h and 10 h of GaQ3 incubation. Results show increased Ca2+ release at 30 min and a slower, maintained, increase over 24 h. MCF-7 cells show higher Ca2+ release than H1299 cells (n= 15). (B) Time course of intracellular Ca2+ release in GaQ3-treated MCF-7 and H1299 cells, using flow cytometry. There was a sharp increase in Ca2+ release at 8 h in MCF-7 (p53+/+) cells, but not in H1299 (p53−/−) cells. Data shown are means ± SD (n= 15). (C) Intracellular Ca2+ release in p53 mutant (PC3) cells using flow cytometry. Results show a constant increase in intracellular calcium release after GaQ3 treatment (n= 15, means ± SD). (D) The role of p53 in intracellular Ca2+ release in MCF-7 cells analysed by silencing p53 gene using p53 siRNA. Time course of intracellular Ca2+ release in GaQ3-treated MCF-7 cells, with or without p53 siRNA showed that the GaQ3-induced sharp increase in the intracellular Ca2+ release at 8 h was abolished, after p53 gene silencing. Data shown are means ± SD (n= 15). (E) p53 protein level in GaQ3-treated MCF-7 cells, by Western blot, was increased (lane 2), relative to untreated cells (control). Lanes 3 and 4 show cells treated with p53 siRNA and tamoxifen as negative and positive controls respectively, Tubulin is used as loading control.
Figure 4
Figure 4
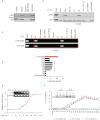
GaQ3 induced p53 expression through Ca2+-mediated stabilization of p5–-p300 transcriptional complex. (A) Co-immunoprecipitation (Co-IPP) of p53 with p300 and mdm2 shows p53–p300 binding in GaQ3-treated cells (lane 2), whereas p53–mdm2 interaction is only observed in untreated cells (lane 1). Tamoxifen (positive control) also induces p53–p300 binding (lane 4) (n= 10). (B) The p53–p300 binding is observed in MCF-7 cells after 24 h, 30 min, 1 h and 3 h of GaQ3 incubation. Results show that p53 binds to p300 at 3 h of GaQ3 incubation (lane 6). p53–p300 interaction was not observed at 30 min and 1 h of GaQ3 incubation; however, p53 and p300 were in a complex after treatment with GaQ3 for 24 h (Figure 3C, as well). Quenching the release of intracellular Ca2+ using TMB-8 (100 µM) abolishes the p53–p300 binding induced upon 3 h of GaQ3 incubation (lane 7). p53 siRNA and p300 siRNA are used as controls (lanes 8 and 9). In this experiment, immunoprecipitation used an anti-p53 N-terminus antibody (Ab421), and Western blots were developed using both anti-p53 and anti-p300 Abs (n= 8). (C) The binding of p53–p300 complex to the p53 minimal promoter at 30 min, 1 h and 3 h of GaQ3 incubation (lanes 7, 8 and 9). Chromatin immunoprecipitation (ChIP) shows strong binding of both p53 and p300 on the −157 to −397 base pairs of p53 minimal promoter in MCF-7 cells treated with GaQ3 for 24 h (lane 3). No binding of either p53 or p300 was observed at 30 min and 1 h of GaQ3 incubation (lanes 7 and 8); however, the binding was present at 3 h (lane 9). Upon quenching of intracellular Ca2+ release using TMB-8, the GaQ3-induced p53–p300 binding on p53 minimal promoter is abolished (lane 10) (n= 8). p53 and p300 did not show binding to the p53 minimal promoter in the untreated cells (lane 2). The non-immunoprecipitated total protein extract (Input), scrambled primers, p53 siRNA and p300 siRNA are used as controls. (D) The activity of p53 2.5 Kb promoter analysed in GaQ3-treated MCF-7 cells over 24 h. Results show a significant increase in p53 2.5 Kb promoter activity at 6 h of GaQ3 incubation. Furthermore, a rise in the promoter activity was observed until 18 h of incubation (*P < 0.05, for values from 6–18 h, n= 4, means ± SD, anova). (E) p53 mRNA level was determined by real-time PCR in GaQ3-treated MCF-7 cells in a time-dependent manner (every hour). Results show a significant increase in p53 mRNA level from 6 h of GaQ3 incubation. (n= 6, means ± SD). The mRNA expression is also analysed using RT-PCR at 0, 6, 12, 18 and 24 h of GaQ3 incubation (inset) (n= 4). (F) Time-dependent analysis of the increase in p53 protein expression and p53 nuclear translocation in GaQ3-treated MCF-7 cells. elisa using p53 whole cell, nuclear and cytoplasmic fractions show a significant increase in p53 protein level and p53 nuclear translocation at 6 h of GaQ3 incubation (n= 8, SD, anova). Furthermore, the p53 nuclear translocation is confirmed by immunoprecipitation experiment using anti p53 C-terminus antibody (421) in GaQ3-treated MCF-7 cells at 0 and 24 h time points (WC: whole cell, NF: nuclear fraction, CF: cytoplasmic fraction) (n= 6).
Figure 5
Figure 5
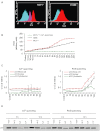
Intracellular Ca2+ release induced ROS in GaQ3-treated cells. (A) Flow cytometry was used to assess ROS generation in GaQ3-treated MCF-7 and H1299 cells (panels 1 and 2).Results show a significant increase in ROS in both cell lines, and the role of p53 in GaQ3-induced ROS is confirmed upon silencing p53 gene (blue, untreated cells; red, GaQ3-treated cells; pink, p53 siRNA in GaQ3-treated cells). Results show that GaQ3 induced higher ROS synthesis in p53+/+ (MCF-7) cells than in p53−/− (H1299) cells (n= 7; Student's t-test). (B) Time-dependent analysis of ROS synthesis, using flow cytometry in GaQ3-treated MCF-7, GaQ3-treated H1299 and GaQ3-treated + Ca2+ quenched MCF-7 cells. p53+/+ (MCF-7) cells show higher generation of ROS around 7 h of GaQ3 treatment, than in p53−/− (H1299) cells, which shows a gradual and constant increase in ROS. Ca2+ quenching using TMB-8 abolishes GaQ3-induced ROS, suggesting that ROS generation is dependent on the intracellular Ca2+ release (n= 8, means ± SD). (C) (Panel i) In vivoelisa shows that quenching of the intracellular Ca2+ release using TMB-8 abolishes the p53 protein expression and p53 nuclear translocation in GaQ3-treated MCF-7 cells. (Panel ii) ROS quenching using N-acetyl cysteine (NAC; 50 µM) shows no change in p53 protein expression and p53 nuclear translocation in GaQ3-treated MCF-7 cells (n= 7, means ± SD). (D) Immunoprecipitation using anti-p53 N terminus (1801Ab) to confirm the results of in vivoelisa. Results (Input, non-immunoprecipitated total protein extract; WC, whole cells; NF, nuclear fraction; CF, cytoplasmic fraction) show that Ca2+ quenching, but not ROS quenching using NAC (50 µM), inhibited up-regulation and nuclear translocation of p53 protein at 10 h of GaQ3 incubation (n= 5).
Figure 6
Figure 6
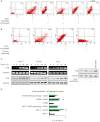
GaQ3 induces FAS-mediated apoptosis in p53−/− cells. (A) FAS silencing, p53 silencing, Ca2+ quenching and combined silencing of p53 and FAS significantly reduced the GaQ3-induced apoptosis in MCF-7 cells (n= 10). (B) Apoptosis was assessed by flow cytometry in GaQ3-treated H1299 cells with FAS silencing and Ca2+ quenching (n= 10). (C) (Panel i) RT-PCR to show increased mRNA for FAS receptor in MCF-7, H1299 and PC3 cells treated with GaQ3 at 0, 6, 12, 18 and 24 h respectively. (Panel ii) Western blot analysis to study expression of FAS protein in MCF-7, H1299 and PC3 cells treated with GaQ3 for 0, 6, 12, 18 and 24 h respectively. (Panel iii) Western blot to study the role of p53 protein in FAS up-regulation upon silencing p53 in GaQ3-treated MCF-7 cells (n= 7). (D) elisa of the cell membrane and the nuclear/cytoplasmic fractions of ROS-quenched, GaQ3-treated MCF-7 and H1299 cells to assess translocation of FAS to the cell membrane. Data shown are means ± SD (n= 8). P < 0.05, significantly greater than untreated MCF-7 cells or H1299 cells, anova).
Figure 7
Figure 7
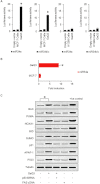
miR-34a was induced and in turn induced the expression of p53 downstream genes involved in apoptosis. (A) Luciferase assay to monitor the mir34a and mir34b/c promoter activity in both untreated and GaQ3-treated MCF-7 and H1299 cells. Results show a significant increase in both mir-34a and mir34b/c promoter activity only in GaQ3-treated MCF-7 cells; note that mir-34a activity is higher than mir-34b/c activity (panels 1 and 2). Data shown are means ± SD (n= 9); *P < 0.05, significant effect of GaQ3, anova. (B) miR-34a RNA expression quantified in GaQ3-treated MCF-7 cells using real-time PCR, showed increased miR34a mRNA expression in MCF-7 cells after GaQ3 (Data shown are means ± SD (n= 5); *P < 0.05, significant effect of GaQ3, anova). (C) Western blot analysis shows the up-regulation of p53 downstream genes in GaQ3-treated MCF-7 cells. The expression of BAX, PUMA, NOXA, BID, SUMO, p21, APAF-1 and PIG3 increased in GaQ3-treated MCF-7 cells (lane 2), and decreased after p53 silencing (lane 3). Transfection with FAS cDNA shows no effect on the expression of these proteins. The cDNA of all the respective proteins are transfected in the MCF-7 cells and used as positive control. Data shown are means ± SD *P < 0.05, significantly different as indicated, anova.
Figure 8
Figure 8
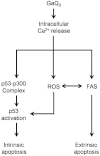
Scheme outlining the mechanisms involved in the action of GaQ3 in cancer cells.

Similar articles

Cited by

References

    1. Barton C, Davies D, Balkwill F, Burke F. Involvement of both intrinsic and extrinsic pathways in IFN-gamma-induced apoptosis that are enhanced with cisplatin. Eur J Cancer. 2005;41:1474–1486. - PubMed
    1. Bennett M, Macdonald K, Chan SW, Luzio JP, Simari R, Weissberg P. Cell surface trafficking of Fas: a rapid mechanism of p53-mediated apoptosis. Science. 1998;282:290–293. - PubMed
    1. Berridge MJ. Inositol trisphosphate and calcium signalling. Nature. 1993;361:315–325. - PubMed
    1. Camello-Almaraz C, Gomez-Pinilla PJ, Pozo MJ, Camello PJ. Mitochondrial reactive oxygen species and Ca2+ signaling. Am J Physiol Cell Physiol. 2006;291:C1082–C1088. - PubMed
    1. Campaner S, Spreafico F, Burgold T, Doni M, Rosato U, Amati B, et al. The Methyltransferase Set7/9 (Setd7) Is Dispensable for the p53-Mediated DNA Damage Response In Vivo. Mol Cell. 2011;43:681–688. - PubMed

Publication types

MeSH terms