. 2011 Nov 15;21(5):813-24.
doi: 10.1016/j.devcel.2011.09.005.

A highly dynamic ER-derived phosphatidylinositol-synthesizing organelle supplies phosphoinositides to cellular membranes

Affiliations

A highly dynamic ER-derived phosphatidylinositol-synthesizing organelle supplies phosphoinositides to cellular membranes

Yeun Ju Kim et al. Dev Cell. .

Abstract

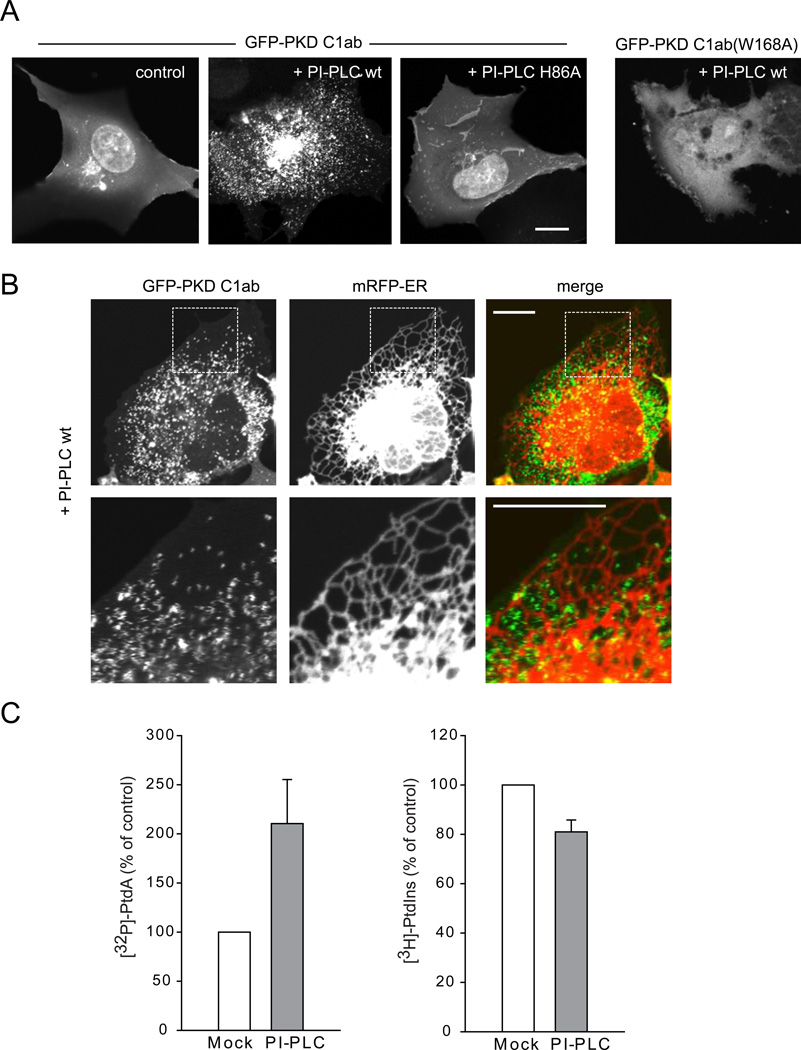
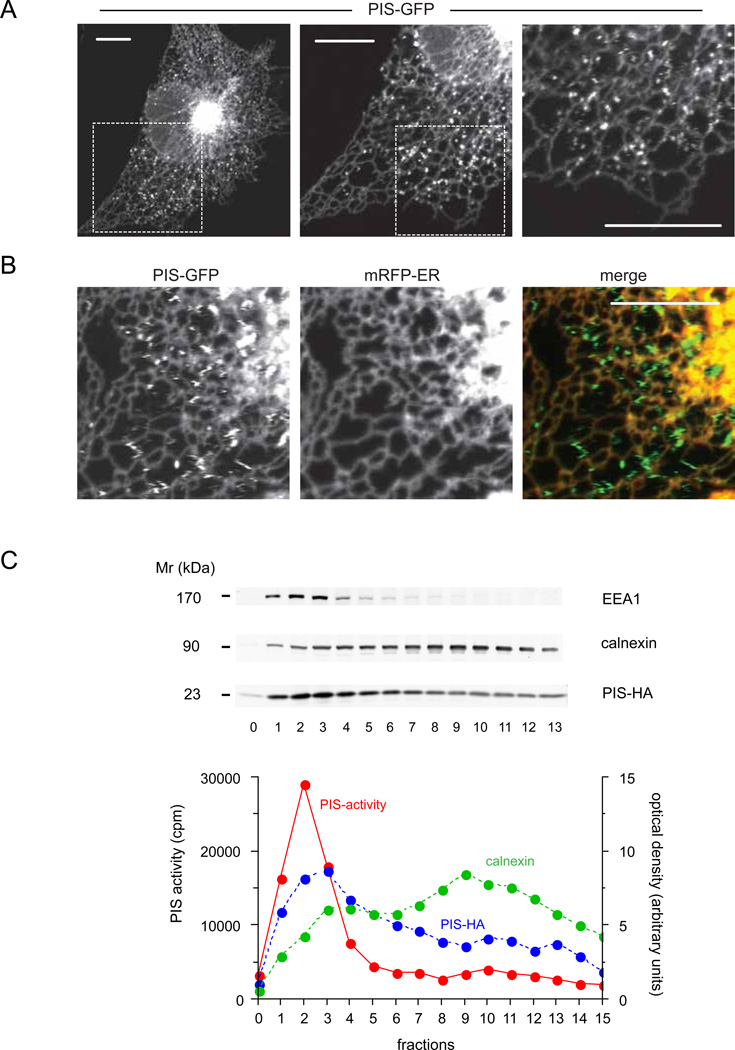
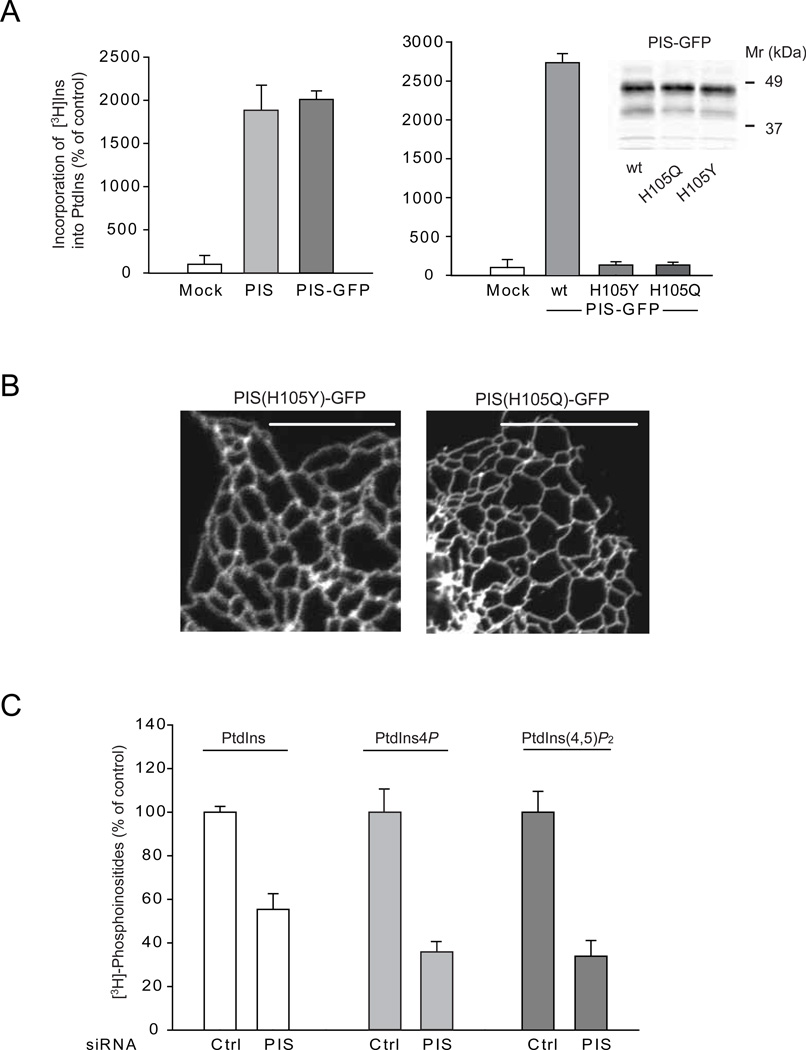
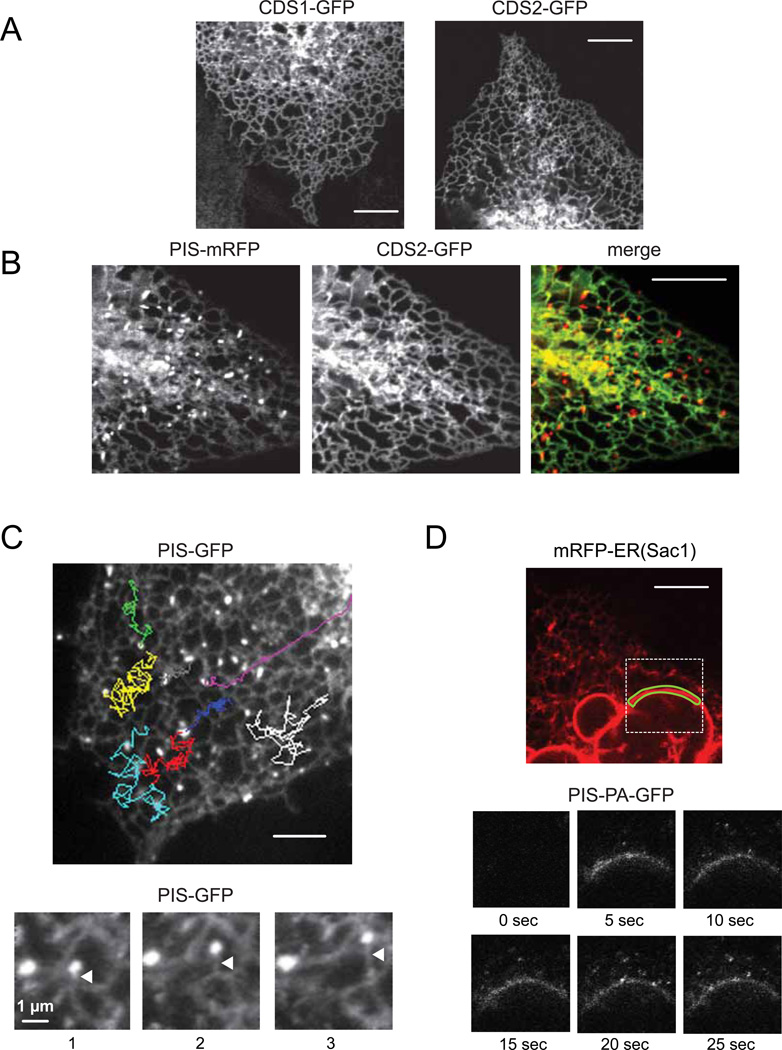
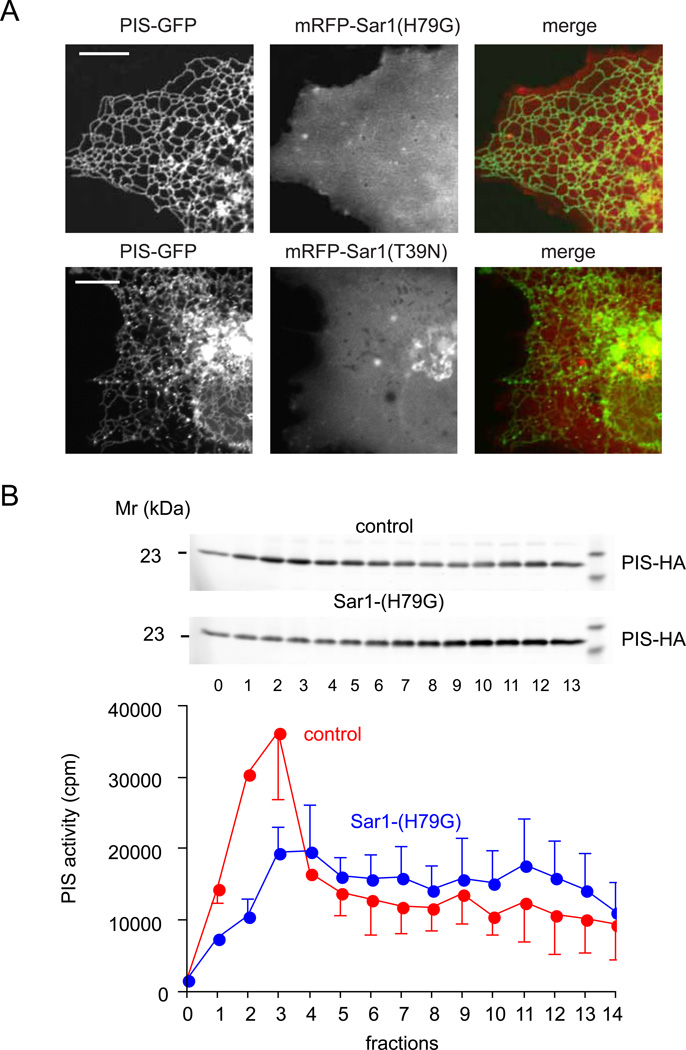
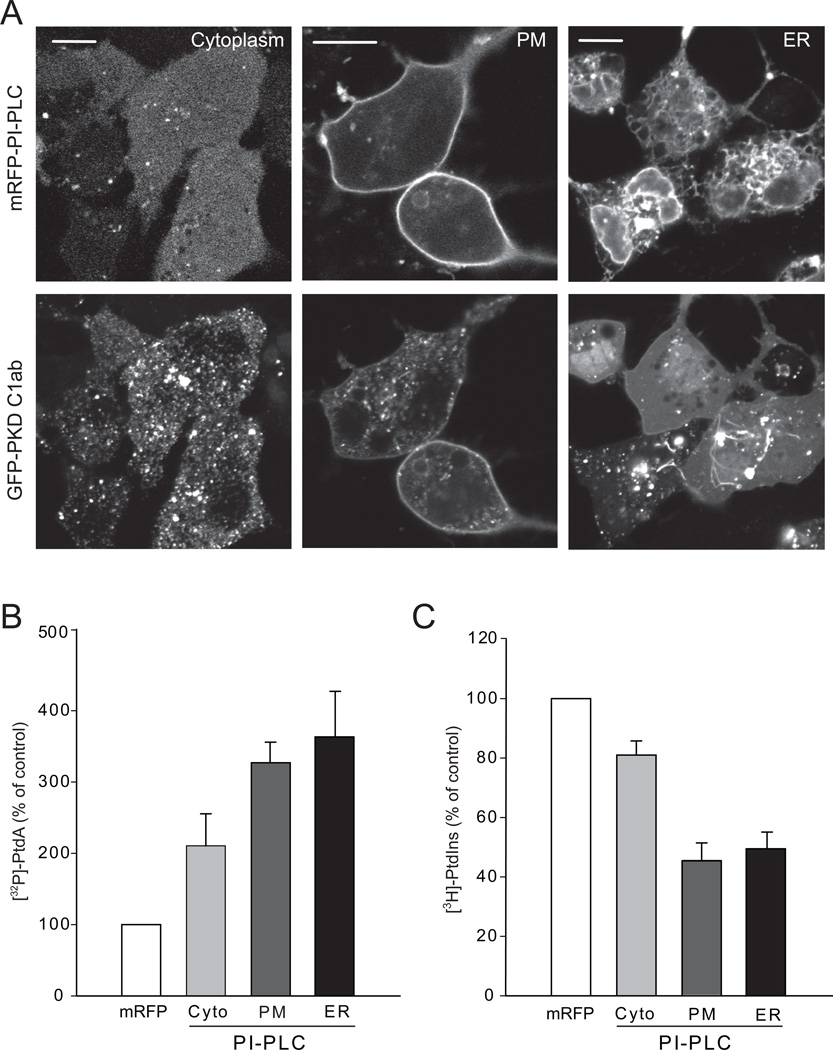
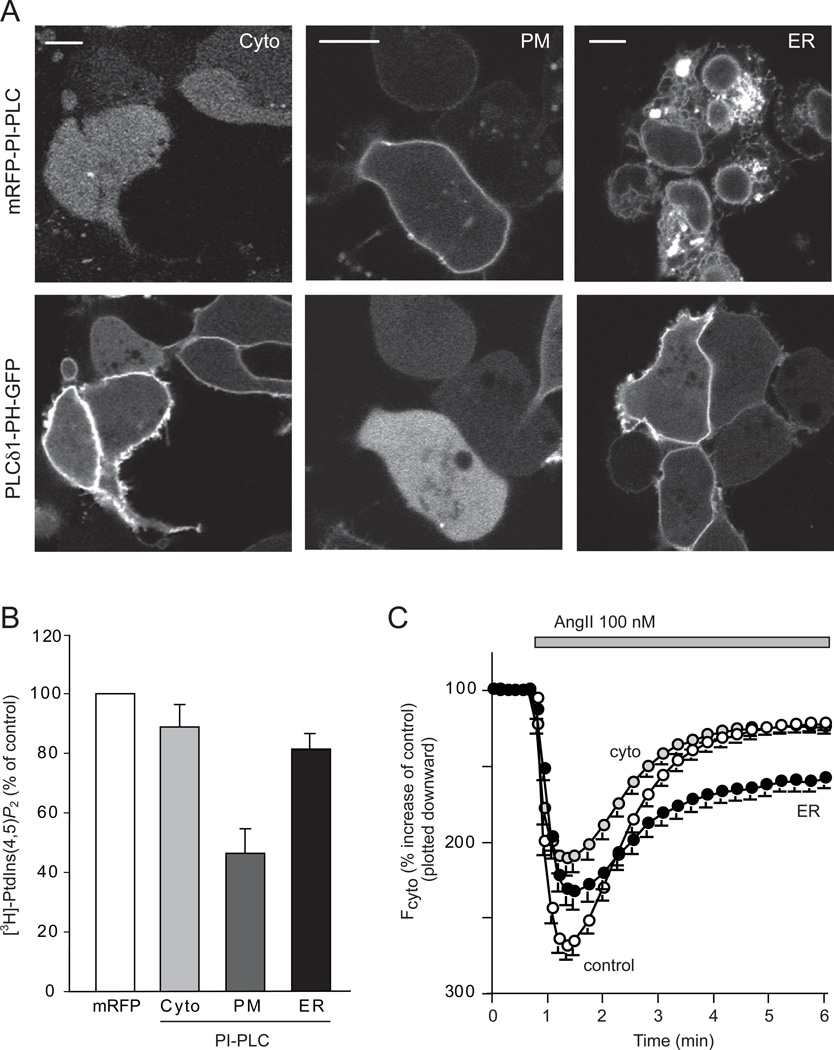
Polyphosphoinositides are lipid signaling molecules generated from phosphatidylinositol (PtdIns) with critical roles in vesicular trafficking and signaling. It is poorly understood where PtdIns is located within cells and how it moves around between membranes. Here we identify a hitherto-unrecognized highly mobile membrane compartment as the site of PtdIns synthesis and a likely source of PtdIns of all membranes. We show that the PtdIns-synthesizing enzyme PIS associates with a rapidly moving compartment of ER origin that makes ample contacts with other membranes. In contrast, CDP-diacylglycerol synthases that provide PIS with its substrate reside in the tubular ER. Expression of a PtdIns-specific bacterial PLC generates diacylglycerol also in rapidly moving cytoplasmic objects. We propose a model in which PtdIns is synthesized in a highly mobile lipid distribution platform and is delivered to other membranes during multiple contacts by yet-to-be-defined lipid transfer mechanisms.


Figures

Figure 1
Figure 1. Association of the DAG sensor with small mobile structures after PI-PLC expression in the cytoplasm
(A) COS-7 cells were transfected with wild-type or mutant GFP-PKD C1ab alone or together with either mRFP-PI-PLC or its lipase mutant H86L (also see Figure S1 and Movie S1). (B) Relationship of the DAG positive structures to the ER. COS-7 cells were co-transfected with CFP-PI-PLC, GFP-PKD C1ab and mRFP-ER using the Sac1 C-terminal ER localization signal. Enlarged images are shown in the lower panels. The zigzagging traces correspond to very rapid movements during scanning in confocal microscopy. Scale bars, 10 µm. (C) HEK293-AT1 cells were transfected with mRFP only or mRFP-PI-PLC and labeled with [32P]phosphate for the last 3 hrs of the one day transfection or myo-[3H]inositol for 24 hrs as described under Methods. Labeled lipids were extracted, separated by TLC, and quantified by a PhosphorImager for [32P] phosphate labeling or by densitometry of exposed films in case of myo-[3H]inositol labeled samples. Error bars indicate SEM (from 4 independent experiments, each performed in duplicates).
Figure 2
Figure 2. Cellular distribution of PIS-GFP
(A) COS-7 cells were transfected with human PIS-fused at its C-terminus with GFP and imaged after 24 h with confocal microscopy. PIS-GFP was localized to the central perinuclear ER and peripheral ER tubules. In addition, note the rapidly moving PIS positive structures that show up as zigzagging traces on the higher magnification scans (A, right panel, see also Figure S2 and Movie S3). (B) Relationship of the PIS positive structures to the ER. COS-7 cells were transfected with PIS-GFP and mRFP-ER. Confocal images show that the mobile structures containing PIS molecule do not contain the ER marker, mRFP-ER. Scale bars, 10 µm. (C) Density gradient separation of membranes. COS-7 cells were transfected with PIS-HA and broken cell membranes were separated on a 10 ml OPTIPREP 10–25% gradient by overnight ultracentrifugation. The distributions of selected markers are shown along with PIS activity measurements from the top 0.5 ml fractions (0–13 of 20). (Fraction “0” is the last 0.5 ml of the sample on top of the gradient proper).
Figure 3
Figure 3. Relationship between PIS activity and localization and effects of PIS knock-down on cellular phosphoinositide levels
(A) Crude membranes prepared from COS-7 cells expressing either an empty vector, the untagged PIS or PIS-GFP or its mutants (H105Y and H105Q) were assayed for PtdIns synthase activity as described under Methods. The incorporation of myo-[3H]inositol into PtdIns using CDP-DAG as a substrate was significantly increased in cells transfected with either forms of wild-type PIS but not the mutant enzymes. The results of a representative experiments are shown performed in duplicates. The inset on the right shows equal expression of the wild-type and mutant PIS-GFP proteins. (B) Cellular localization of mutant PIS-GFP enzymes (H105Y and H105Q) expressed in COS-7 cells. Note the lack of the mobile PIS positive structures. (C) HEK293-AT1 cells were treated with control siRNA or PIS siRNA for 3 days and labeled with myo-[3H]inositol for 24 hrs as described under Methods. Labeled lipids were extracted from the cell pellets, separated by TLC, and analyzed by a densitometry of exposed films. Error bars indicate SEM (from 3 independent experiments, each performed in duplicates). In other experiments where the separated lipids were eluted and counted with a scintillation counter, the labeling of PtdIns4P and PtdIns(4,5)P2 were 6 and 4 %, respectively, of that of PtdIns.
Figure 4
Figure 4. Cellular localization of CDS enzymes and the origin and movements of PIS positive mobile structures
(A) COS-7 cells were transfected with human CDS1 or CDS2-fused at their C-termini with GFP and imaged after 24 hrs with confocal microscopy. Both CDS-GFPs were distributed at perinuclear and tubular regions of the ER. (B) PIS-mRFP and CDS2-GFP were co-expressed in COS-7 cells and their images showed that the PIS positive mobile structures did not contain CDS2 molecule. (C) Tracking the movements of selected PIS positive mobile objects from a time-lapse recording of COS-7 cells expressing PIS-GFP. The MetaMorph software was used to follow the movements of individual objects shown by different colors. (Movie S4). Selected frames from a series of time-lapse images from PIS-GFP expressing COS-7 cells (lower panels). Here, the PIS mobile objects appear to remain attached to ER tubules as the latter were extending. These images were processed using the basic filters function of the MetaMorph software (low pass, 10 pixels) to decrease noise. Arrowheads point to the growing ER tubule. (D) COS-7 cells were co-transfected with mRFP-ER and PIS-tagged with photoactivable GFP (PIS-PA-GFP). The small region of the nuclear envelope, outlined with green line, was repeatedly photoactivated by 405 nm laser and the images were taken at the indicated times (see also Movie S5). Note that PIS positive mobile objects became visible after photoactivating only the small region of the nuclear envelope (lower panels). See also Figure S3 and Movie S7 for localization of PIS relative to PM-ER contact zones and Movies S6 and S8 for analysis of the relationship between PIS membranes and Golgi and PM, respectively.
Figure 5
Figure 5. Sar1 activity is required for the generation of the dynamic PIS organelle
(A) COS-7 cells were co-transfected with mRFP-HA-Sar1(H79G) or mRFP-HA-Sar1(T39N) and PIS-GFP. Simultaneous presence of the Sar1 GTP-locked mutant (H79G) completely eliminated the mobile PIS positive structures. Sar1-GDP (T39N) had a similar inhibitory effect but it was not as effective. (B) Density gradient separation of membranes from COS-7 cells expressing PIS-HA enzyme with or without Sar1-H79G. Broken cell membranes were separated on a 10 ml OPTIPREP 10–25% gradient by overnight ultracentrifugation and PIS distribution and PIS enzymatic activity were determined by Western Blotting and an enzymatic assay, respectively. The average and range of two separate experiments are shown.
Figure 6
Figure 6. Depletion of different pools of PtdIns by membrane targeted PI-PLC enzymes
(A) The GFP-tagged DAG sensor was expressed with the cytoplasmic mRFP-tagged PI-PLC (left), its targeted versions directed to the PM (middle) or the cytoplasmic surface of the ER (right) in HEK293-AT1 cells. Scale bars, 10 µm. (B, C) HEK293-AT1 cells were transfected with the cytoplasmic or membrane targeted versions of PI-PLC and labeled with [32P]phosphate for 3 hrs at the end of one day transfection or myo-[3H]inositol for 24 hrs as described under Methods. Labeled lipids were extracted from the cell pellets, separated by TLC, and quantified either by a PhosphorImager for [32P] phosphate labeling or densitometry of films for myo-[3H]inositol samples. Error bars indicate SEM (from 4 independent experiments, each performed in duplicates). Also see Figure S4 for the effects of PtdIns depletion on the level of [3H]PtdIns4P and distribution of cellular PtdIns4P and PtdIns3P reporters.
Figure 7
Figure 7. Effects of PtdIns depletion by expression of PI-PLC enzymes on the plasma membrane PtdIns(4,5)P2
(A) The PtdIns(4,5)P2 sensor, PLCδ1-PH-GFP was expressed with mRFP-conjugated cytoplasmic, PM- or ER- targeted PI-PLC in HEK293-AT1 cells. Scale bars, 10 µm. (B) HEK293-AT1 cells were transfected with the various forms of PI-PLC and labeled with myo-[3H]inositol for 24 hrs as described under Methods. Labeled lipids were extracted from the cell pellets, separated by TLC, and quantified by densitometry of exposed films to measure total myo-[3H]inositol labeled PtdIns(4,5)P2 levels. Error bars indicate SEM (from 4 independent experiments, each performed in duplicates). (C) PLCδ1-PH-GFP was expressed together with mRFP only, cytoplasmic-, PM- or ER- targeted PI-PLC in HEK293-AT1 cells. After 24 hrs, cells were analyzed by confocal microscopy and time-lapse images were recorded after AngII stimulation. The average responses of the cytoplasmic fluorescence intensity of 80–100 cells (mean ± S.E.M) are shown. After normalization to pre-stimulatory levels, these intensity increases were plotted downward to better conceptualize that they reflect the PtdIns(4,5)P2 decreases in the membrane. Note the PH domain was only partially re-localized to the membrane in cells expressing ER-PI-PLC.

Comment in

Similar articles

Cited by

References

    1. Acharya JK, Labarca P, Delgado R, Jalink K, Zuker CS. Synaptic defects and compensatory regulation of inositol metabolism in inositol polyphosphate 1-phosphatase mutants. Neuron. 1998;20:1219–1229. - PubMed
    1. Agranoff BW, Bradley RM, Brady RO. The enzymatic synthesis of inositol phosphatide. J.Biol.Chem. 1958;233:1077–1083. - PubMed
    1. Balla T, Baukal AJ, Guillemette G, Catt KJ. Multiple pathways of inositol polyphosphate metabolism in angiotensin-stimulated adrenal glomerulosa cells. J.Biol.Chem. 1988;263:4083–4091. - PubMed
    1. Balla T, Szentpetery Z, Kim YJ. Phosphoinositide signaling: new tools and insights. Physiology (Bethesda) 2009;24:231–244. - PMC - PubMed
    1. Balla T, Varnai P. Visualization of cellular phosphoinositide pools with GFP-fused protein-domains. Chapter 24, Unit 24 24. Curr Protoc Cell Biol. 2009 - PMC - PubMed

Publication types

MeSH terms

Substances