. 2011 Dec 9;334(6061):1420-4.
doi: 10.1126/science.1213214. Epub 2011 Nov 10.

Interconversion between intestinal stem cell populations in distinct niches

Affiliations

Interconversion between intestinal stem cell populations in distinct niches

Norifumi Takeda et al. Science. .

Abstract

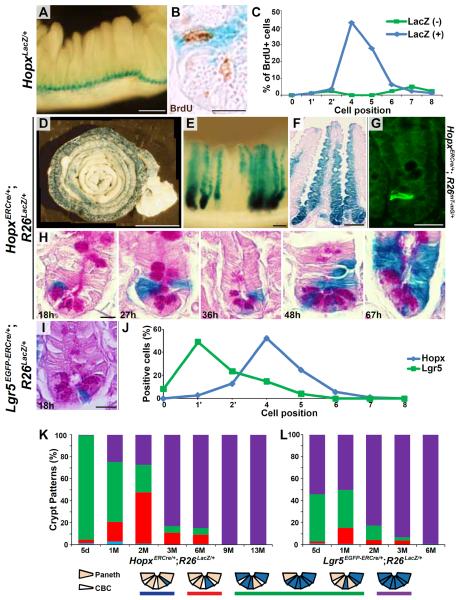
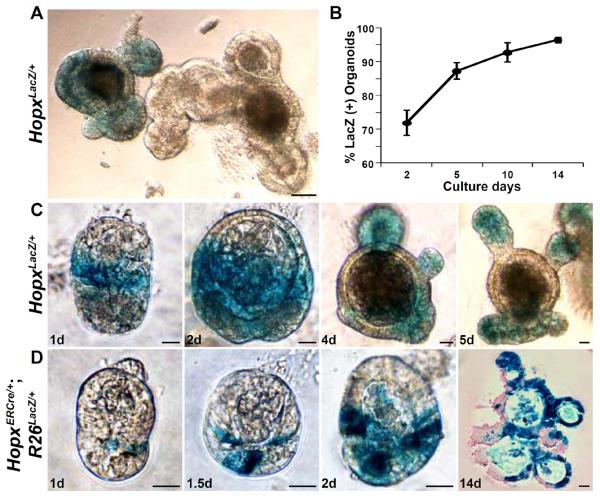
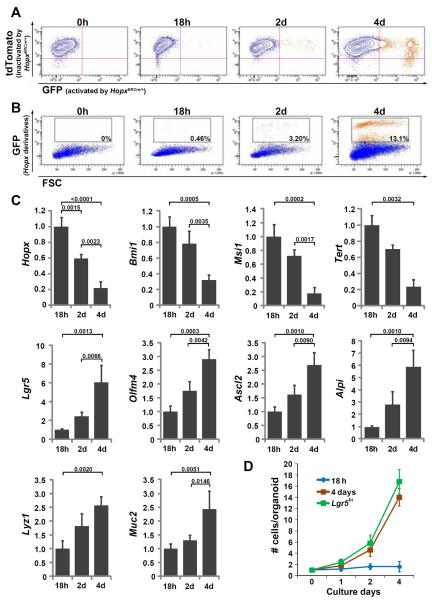
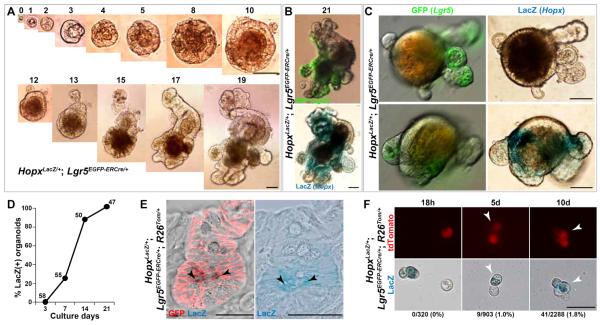
Intestinal epithelial stem cell identity and location have been the subject of substantial research. Cells in the +4 niche are slow-cycling and label-retaining, whereas a different stem cell niche located at the crypt base is occupied by crypt base columnar (CBC) cells. CBCs are distinct from +4 cells, and the relationship between them is unknown, though both give rise to all intestinal epithelial lineages. We demonstrate that Hopx, an atypical homeobox protein, is a specific marker of +4 cells. Hopx-expressing cells give rise to CBCs and all mature intestinal epithelial lineages. Conversely, CBCs can give rise to +4 Hopx-positive cells. These findings demonstrate a bidirectional lineage relationship between active and quiescent stem cells in their niches.


Figures

Fig. 1
Fig. 1. Hopx labels ISCs at the +4 position in intestinal epithelial crypts
(A) Whole mount X-gal stained small intestine from a HopxLacZ/+ mouse. (B) Double staining of HopxLacZ/+ intestine for LacZ and BrdU using a post-irradiation regeneration labeling protocol. (C) Quantification of BrdU positive cells at each crypt position. (D) Composite image (9 images combined into 1) of X-gal stained HopxERCre/+;R26LacZ/+ small intestine 2 months after a 5 day tamoxifen pulse. (E and F) X-gal staining 13 months after tamoxifen induction; whole-mount image (E) and eosin counter-stained section (F). (G) Immunohistochemical GFP staining in crypts of HopxERCre/+;R26mT-mG/+ mice 18h after tamoxifen induction. GFP-positive cells are at the +4 position. (H) Time course of Hopx lineage tracing (HopxERCre/+;R26LacZ/+) after a single tamoxifen pulse. (I) X-gal staining of Lgr5EGFP-ERCre/+;R26LacZ/+ intestine 18 hours after tamoxifen induction. Lgr5 cells are found between Paneth cells at the crypt base. (J) Comparison of the location of Lgr5 and Hopx positive cells in the small intestine. Lgr5-expressing cells are predominantly at the 1' or 2' position while most Hopx-expressing cells are at the +4 or +5 position (5). (Analysis performed 18 hours after a single pulse of tamoxifen.) (K and L) The pattern of X-gal staining was analyzed in HopxERCre/+;R26LacZ/+ (K) and Lgr5EGFP-ERCre/+;R26LacZ/+ (L) mice after a 5 day tamoxifen induction (chase periods as indicated, M=months). Staining patterns were scored according to the key below the graphs. Scale bars: 10 μm (B, H, I), 25 μm (G), 100 μm (E and F), 250 μm (A), and 1000 μm (D).
Fig. 2
Fig. 2. Organoid cultures of Hopx-labeled cells
(A) X-gal stained organoids from HopxLacZ/+ mice after 9 days of crypt culture. (B) Time course of the percentage of LacZ-positive organoids derived from HopxLacZ/+ mice. Two hundred organoids from three different HopxLacZ/+ mice were analyzed (error bars: 1 s.d.). (C) Examples of crypt organoids from HopxLacZ/+ mice stained with X-gal. (D) Examples of crypt organoids from HopxERCre/+;R26LacZ/+ mice (tamoxifen pulse for 12h on day 0.5 of culture). X-gal stained images are shown with a 14 day eosin counter-stained image. Scale bars: 50 μm (A) and 20 μm (C and D).
Fig. 3
Fig. 3. FACS and gene expression of Hopx descendants
(A and B) FACS sorted Hopx descendants after a pulse of tamoxifen (HopxERCre/+;R26mT-mG/+). Representative plots from one of three experiments are shown. Analysis of Hopx descendants at the indicated time periods after a single pulse of tamoxifen to HopxERCre/+;R26mT-mG/+ mice demonstrates a gradual increase in the number of cells expressing GFP (orange), representing Hopx derivatives, and a concomitant loss of the tdTomato signal (blue, ubiquitously expressed until inactivated by HopxERCre/+ expression). Percentages of cells expressing GFP are shown in the gated population in (B). (C) Gene expression of GFP-positive cells was determined by qRT-PCR (normalized to GAPDH). Results are expressed relative to the level of gene expression observed 18 hours after tamoxifen induction, n=3. (D) Rate of growth per organoid, n=5. Hopx derivatives 18 h (blue) or 4 d (brown) after tamoxifen induction of HopxERCre/+;R26mT-mG/+ mice, and Lgr5hi (green) cells from HopxLacZ/+;Lgr5EGFP-ERCre/+ mice were utilized (error bars: 1 s.d.).
Fig. 4
Fig. 4. Lgr5 positive cells can give rise to Hopx positive cells
(A and B) Organoid cultures from single Lgr5hi cells (HopxLacZ/+;Lgr5EGFP-ERCre/+). Days of growth above each panel. (B) Day 21 GFP and ß-galactosidase expression. (C) Day 7 single Lgr5hi cell organoid cultures. There are both LacZ negative (top) and positive organoids (bottom). (D) Percentage of organoids derived from single Lgr5hi cells (HopxLacZ/+;Lgr5EGFP-ERCre/+) that are LacZ-positive. (Number of organoids analyzed listed above each time point.) (E) Confocal image of LacZ and GFP double staining 5 months after 5 day tamoxifen pulse to HopxLacZ/+;Lgr5EGFP-ERCre/+;R26mT-mG/+ mice (black arrowheads points to double positive cells). The right panel (E) is a light microscope image of the same crypt demonstrating LacZ expression, and arrowheads point to LacZ positive, +4 cells. GFP expression (shown as red membrane-bound signal) demarcates Lgr5 derivatives while LacZ (blue) indicates Hopx expression. (F) Representative images of double positive cells isolated after a single pulse of tamoxifen to HopxLacZ/+;Lgr5EGFP-ERCre/+;R26Tom/+ mice. Percentage of double positive cells as compared to tdTomato cells are shown. Note, 18 hours after a single pulse, there are zero double positive cells. White arrowhead points to double positive cell in representative images. tdTomato (red) indicates Lgr5 derivatives; LacZ (blue) indicates Hopx expression. Scale bars: 25 μm (E, F) and 50 μm (A, B, C).

Comment in

References

    1. Vries RG, Huch M, Clevers H. Molecular oncology. 2010 Oct;4:373. - PMC - PubMed
    1. Li L, Clevers H. Science. 2010 Jan 29;327:542. - PMC - PubMed
    1. Potten CS, Kovacs L, Hamilton E. Cell and tissue kinetics. 1974 May;7:271. - PubMed
    1. Sangiorgi E, Capecchi MR. Nature genetics. 2008 Jul;40:915. - PMC - PubMed
    1. Barker N, et al. Nature. 2007 Oct 25;449:1003. - PubMed

Publication types

MeSH terms