. 2012 Mar;40(5):2197-209.
doi: 10.1093/nar/gkr985. Epub 2011 Nov 10.

A supramolecular assembly formed by influenza A virus genomic RNA segments

Affiliations

A supramolecular assembly formed by influenza A virus genomic RNA segments

Emilie Fournier et al. Nucleic Acids Res. 2012 Mar.

Abstract

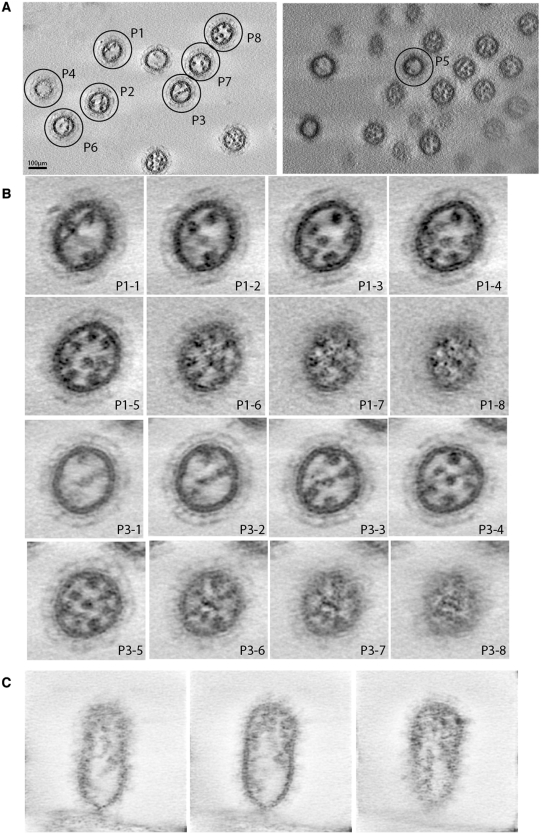
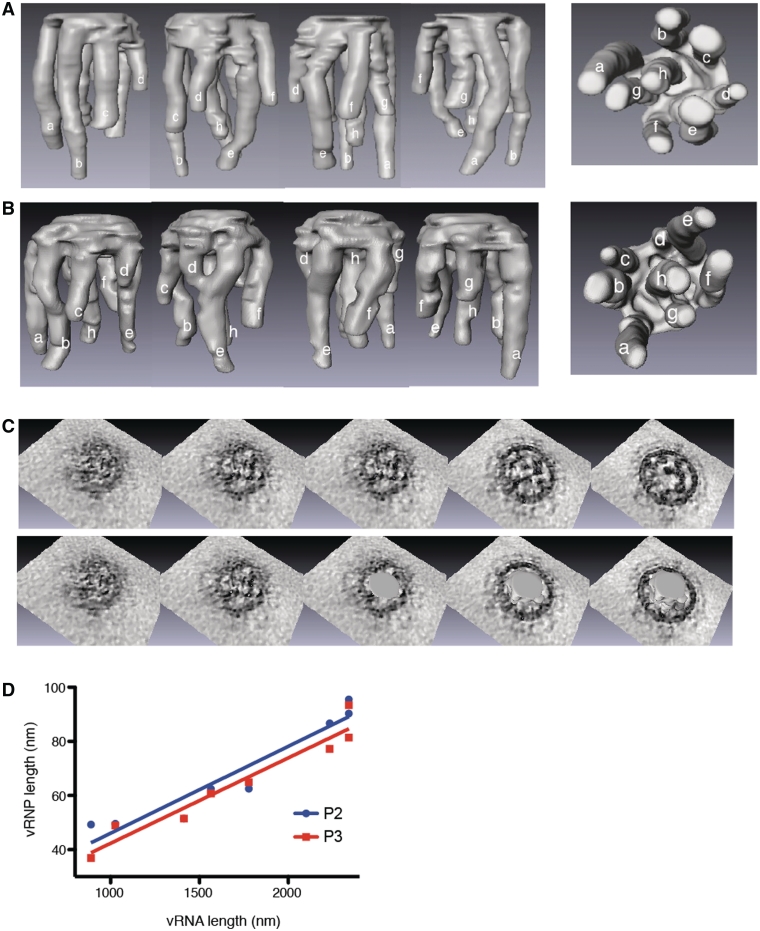
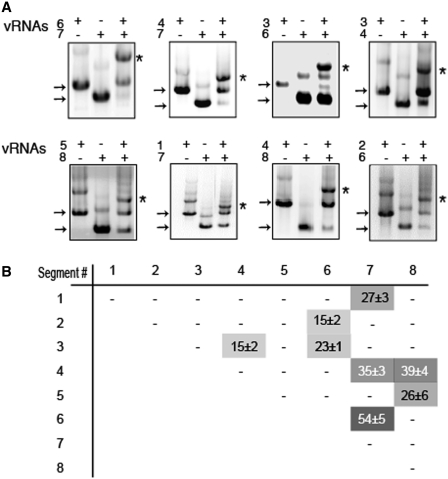
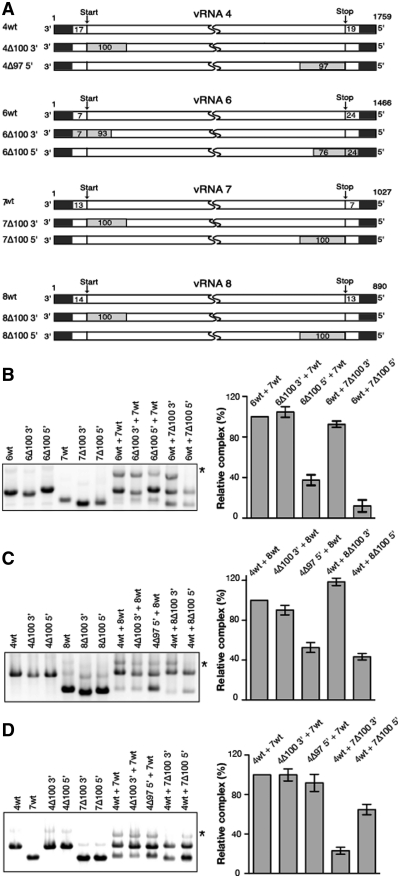
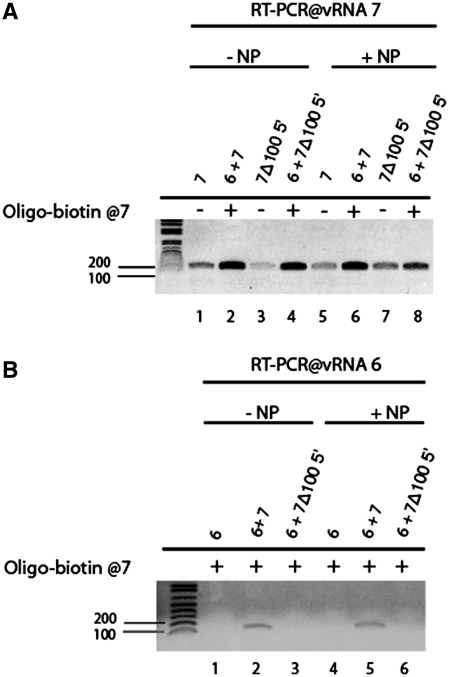
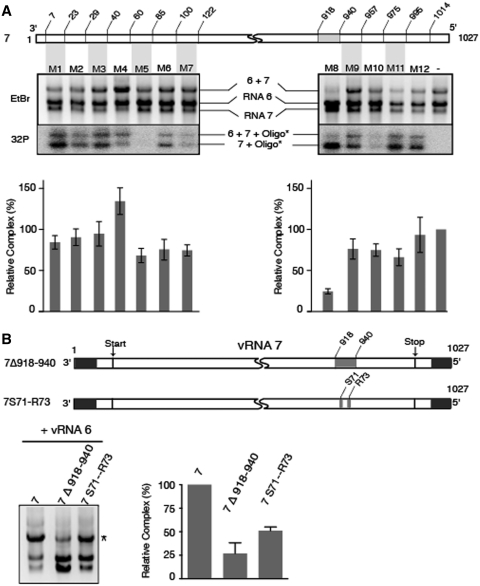
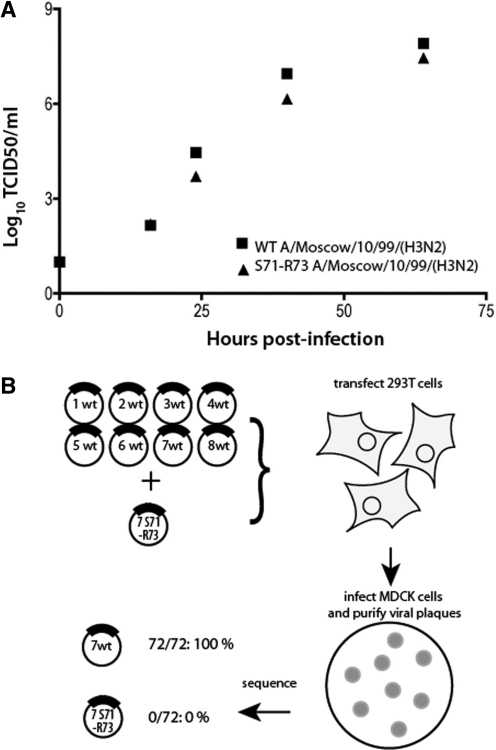
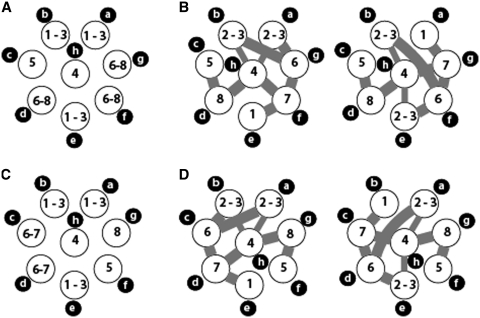
The influenza A virus genome consists of eight viral RNAs (vRNAs) that form viral ribonucleoproteins (vRNPs). Even though evidence supporting segment-specific packaging of vRNAs is accumulating, the mechanism ensuring selective packaging of one copy of each vRNA into the viral particles remains largely unknown. We used electron tomography to show that the eight vRNPs emerge from a common 'transition zone' located underneath the matrix layer at the budding tip of the virions, where they appear to be interconnected and often form a star-like structure. This zone appears as a platform in 3D surface rendering and is thick enough to contain all known packaging signals. In vitro, all vRNA segments are involved in a single network of intermolecular interactions. The regions involved in the strongest interactions were identified and correspond to known packaging signals. A limited set of nucleotides in the 5' region of vRNA 7 was shown to interact with vRNA 6 and to be crucial for packaging of the former vRNA. Collectively, our findings support a model in which the eight genomic RNA segments are selected and packaged as an organized supramolecular complex held together by direct base pairing of the packaging signals.


Figures

Figure 1.
Figure 1.
Electron tomography of budding H3N2 influenza A virions. (A) Two single fields of view indicating eight virions, named P1–P8, that have been selected for further analysis. (B) Transversal sections of viral particles P1 (Panels P1-1–P1-8) and P3 (Panels P3-1–P3-8). (C) Longitudinal sections of a viral particle attached to the cell from which it is budding.
Figure 2.
Figure 2.
3D surface rendering of the vRNPs in budding H3N2 influenza A virions. (A and B). Side and bottom views of the 3D surfaces of the interior of particles P2 (A) and P3 (B). vRNPs are labelled anticlockwise from a to g, starting with the two longest adjacent vRNPs, and h is the central vRNP. (C) Views of the top of P2 without (upper panel) or with superimposition of the 3D surfaces. (D) Correlation between the length of the vRNPs and the length of the vRNAs. The length of the vRNPs measured in the 3D-reconstructions of P2 (blue dots) and P3 (red squares) is plotted against the length of the vRNAs. The compaction factor of the vRNAs in the vRNP is calculated from the slope of the lines (slope = 0.032 ± 0.004 for P2 and 0.032 ± 0.003 for P3).
Figure 3.
Figure 3.
In vitro interactions between vRNAs. (A) Analysis of the RNA/RNA interactions by native agarose gel electrophoresis. Individual vRNAs are indicated by arrows and intermolecular complexes are marked by asterisks. (B) Quantification of the complexes. The weight fraction (%) of the RNA mass migrating as an intermolecular complex is expressed as mean ± SEM (n = 3−19). −, <10% complex. The grey levels (on a 0–100 scale) directly correspond to the percentage of complex formed.
Figure 4.
Figure 4.
Effect of terminal deletions on the three strongest in vitro vRNA/vRNA interactions. (A) Schematic representation and nomenclature of the wild-type and mutant vRNAs. Deletions are represented by grey rectangles. Numbering of the genomic vRNAs is from 3′- to 5′-end. (B–D) Representative gels and quantifications are shown for interactions between wild-type or mutant vRNAs 6 and 7 (B), 4 and 8 (C) and 4 and 7 (D). Intermolecular complexes are marked by asterisks. The weight fraction (%) of the RNA mass migrating as an intermolecular complex was determined for each vRNA pair, and for each panel the intermolecular complex obtained with mutant vRNAs was normalized relative to the complex formed by the two wild-type vRNAs. Quantifications are expressed as mean ± SEM (n = 3−10).
Figure 5.
Figure 5.
Interaction of wild-type vRNA 7 and vRNA 7Δ100 5′ with vRNA 6 in the presence of NP. vRNA 7 without or with a 100 nt deletion at the 5′-end of the coding sequence was modified to include a 3′ overhang complementary to a biotinylated DNA oligonucleotide. Modified vRNA 7 and vRNA 6 were first transcribed and incubated separately with saturating amounts of NP, then incubated together. The biotinylated DNA oligonucleotide was used to retain the complexes on magnetic beads, and segment-specific PCR was used to detect vRNA 7 (A) and vRNA 6 (B) retained on the beads in the absence (−NP) or in the presence of NP (+NP).
Figure 6.
Figure 6.
Precise mapping of a region of vRNA 7 interacting with vRNA 6. (A) A region interacting with vRNA 6 was identified using oligonucleotides complementary to the 3′ and 5′ regions of vRNA 7. A representative gel is shown. Ethidium bromide (EtBr) staining allowed quantification of the complex formed between vRNAs 6 and 7, while autoradiography of the 32P radiolabelled oligonucleotides allowed to monitor binding of the DNA oligonucleotides to vRNA 7 during in vitro transcription. (B) A deletion or substitutions in the 918–940 region of vRNA 7 affect interaction with vRNA 6. Mutation S71–R73 correspond to substitution of nucleotides 924, 925 926, 930 and 932. In A and B, intermolecular complexes are marked by asterisks. Relative variations of the amount of complex were determined as in Figure 4 and are given as mean ± SEM (n = 3−7).
Figure 7.
Figure 7.
Effect of silent mutations S71 and R73 on viral replication and on incorporation of vRNA 7. (A) MDCK cells were infected at a m.o.i. of 10−4 with wild-type recombinant A/Moscow/10/99 (H3N2) virus or a virus bearing silent mutations at M2 codons 71 and 73. The release of viral progeny into the supernatant was monitored by determining the tissue culture infective dose (TCID50). Points correspond to the mean of two experiments; the data ranges are smaller than the symbol size. (B) Strategy and output of the competition experiment.
Figure 8.
Figure 8.
Possible arrangements of the vRNPs within budding H3N2 influenza A virions. Top views of the possible arrangements of the vRNPs in P2 (A and B) and P3 (C and D) based on tomography data alone (a and c) or incorporating the in vitro interaction data (B and D). The intermolecular RNA interactions identified in vitro are indicated by thick grey line. The two thin lines correspond to the interaction between vRNAs 3 and 4 and are mutually exclusive, depending on the actual location of vRNAs 2 and 3.

References

    1. Horimoto T, Kawaoka Y. Influenza: lessons from past pandemics, warnings from current incidents. Nat. Rev. Microbiol. 2005;3:591–600. - PubMed
    1. Palese P, Shaw M. Orthomyxoviridae: The viruses and their replication. In: Knipe DM, Howley PM, editors. Fields Virology. Philadelphia: Lippincott, Williams and Wilkins; 2006. pp. 1647–1689.
    1. Calder LJ, Wasilewski S, Berriman JA, Rosenthal PB. Structural organization of a filamentous influenza A virus. Proc. Natl Acad. Sci. USA. 2010;107:10685–10690. - PMC - PubMed
    1. Harris A, Cardone G, Winkler DC, Heymann JB, Brecher M, White JM, Steven AC. Influenza virus pleiomorphy characterized by cryoelectron tomography. Proc. Natl Acad. Sci. USA. 2006;103:19123–19127. - PMC - PubMed
    1. Hutchinson EC, Curran MD, Read EK, Gog JR, Digard P. Mutational analysis of cis-acting RNA signals in segment 7 of influenza A virus. J. Virol. 2008;82:11869–11879. - PMC - PubMed

Publication types