. 2011;6(11):e27339.
doi: 10.1371/journal.pone.0027339. Epub 2011 Nov 4.

Fascin is a key regulator of breast cancer invasion that acts via the modification of metastasis-associated molecules

Affiliations

Fascin is a key regulator of breast cancer invasion that acts via the modification of metastasis-associated molecules

Monther Al-Alwan et al. PLoS One. 2011.

Abstract

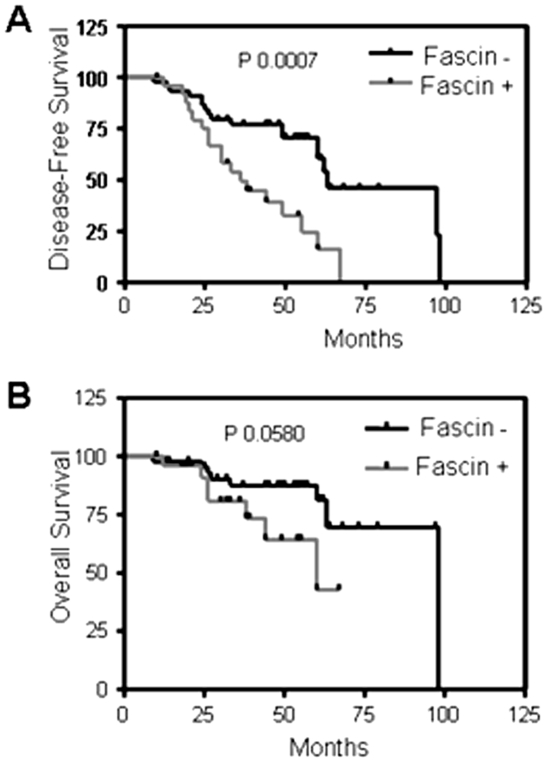
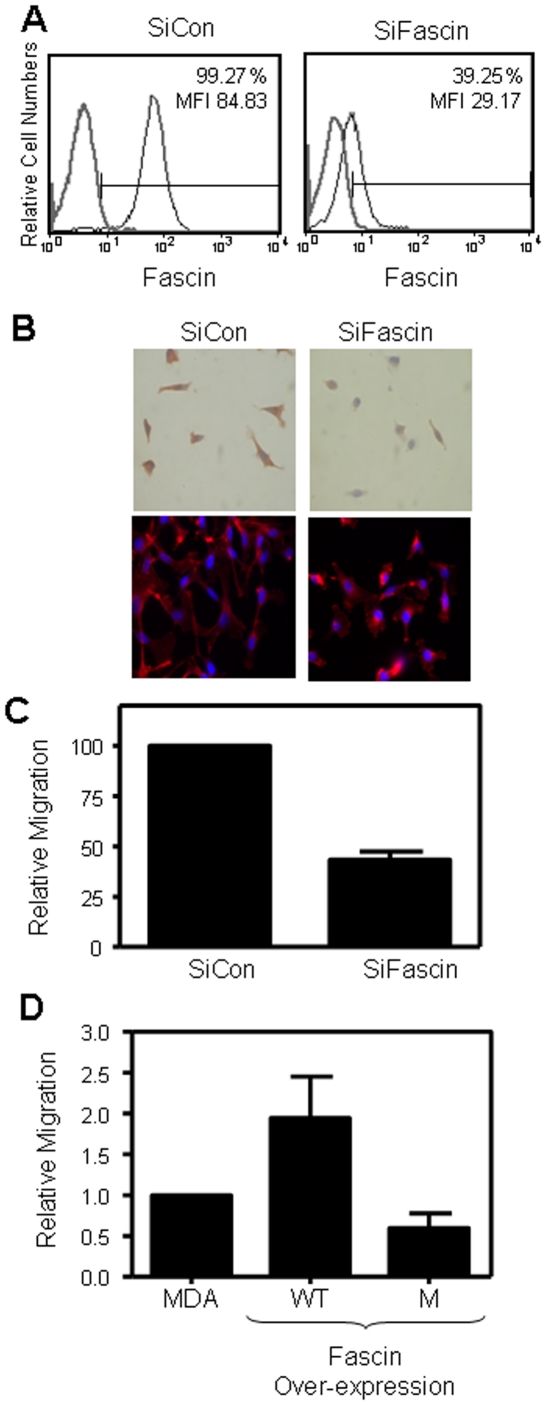
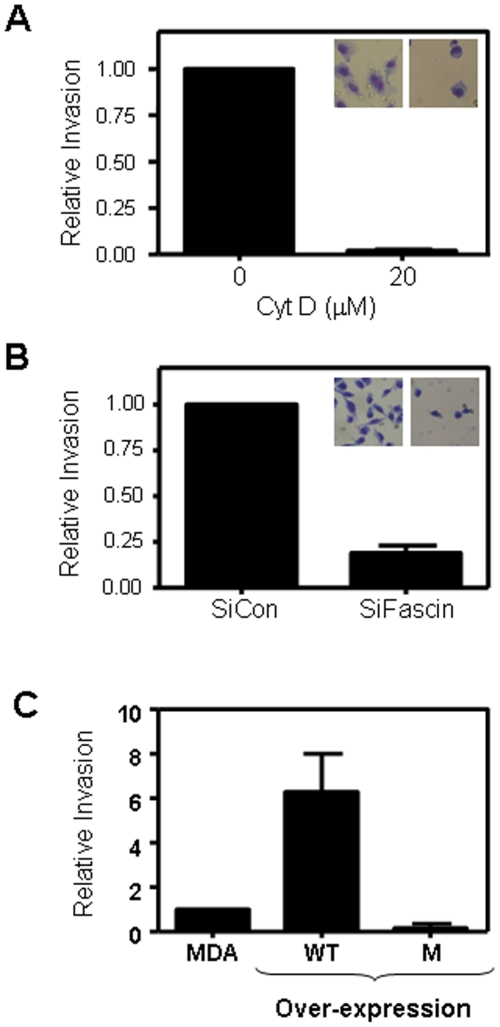
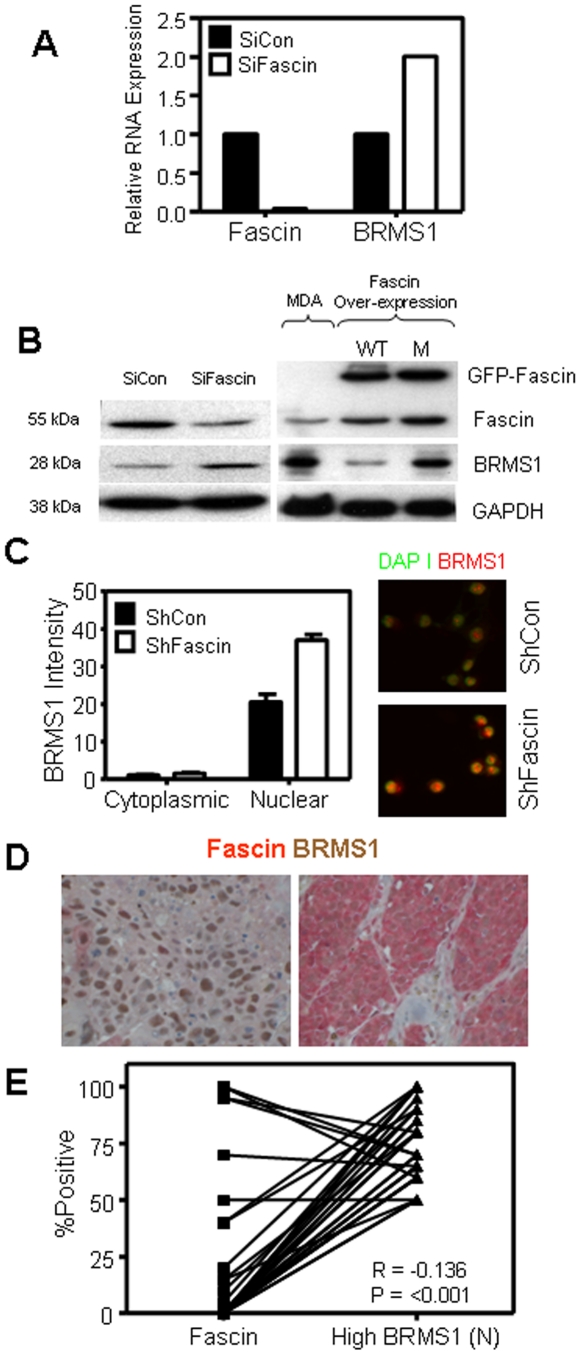
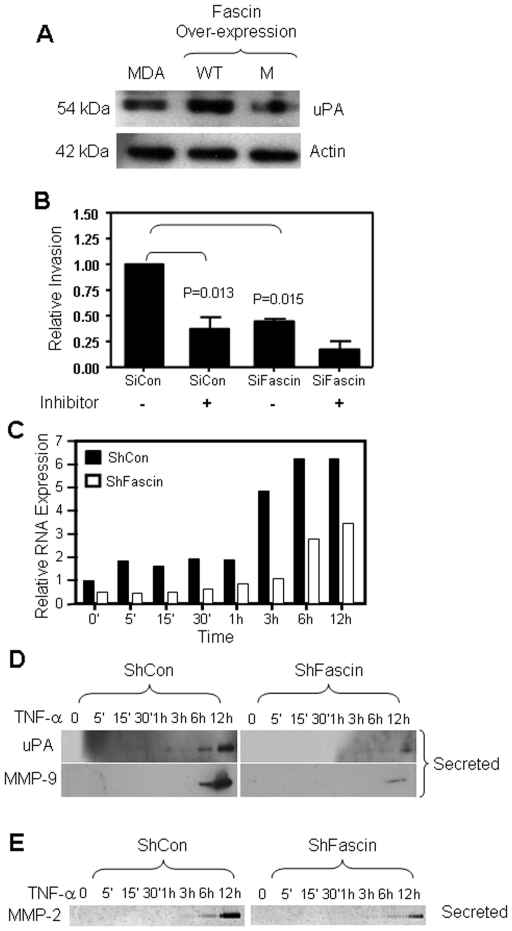
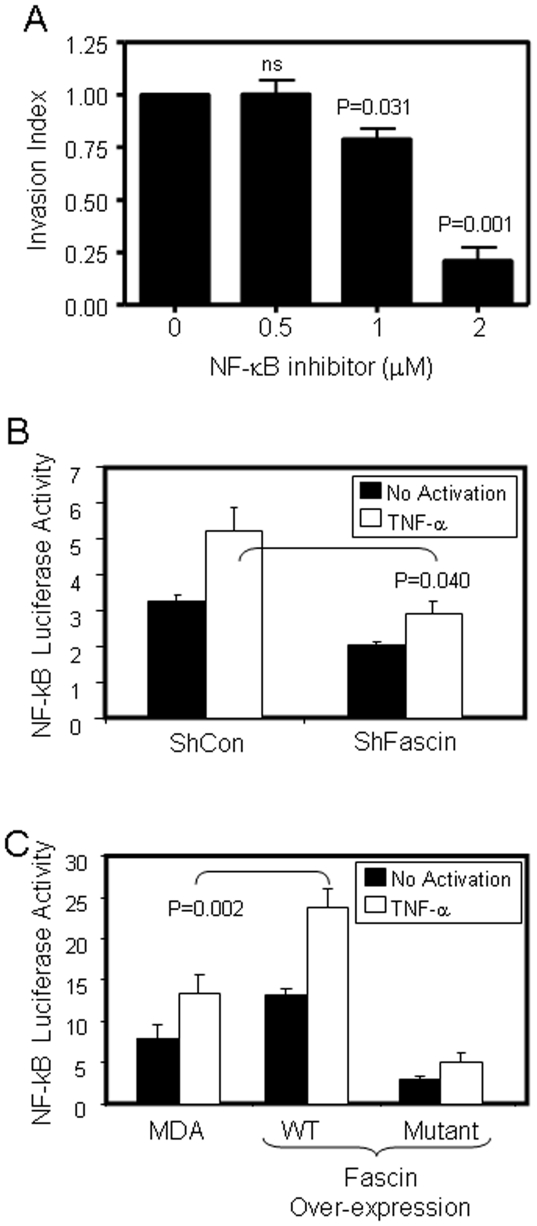
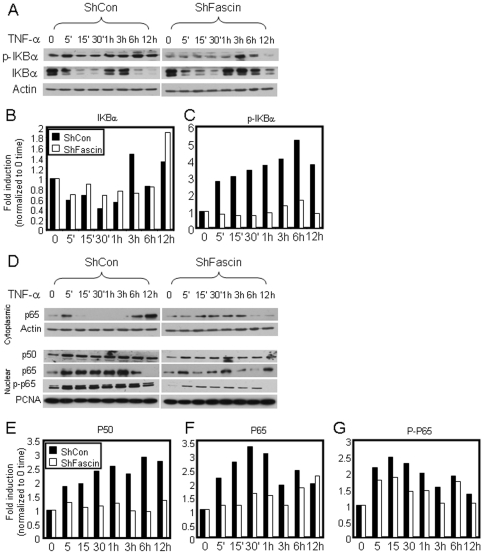
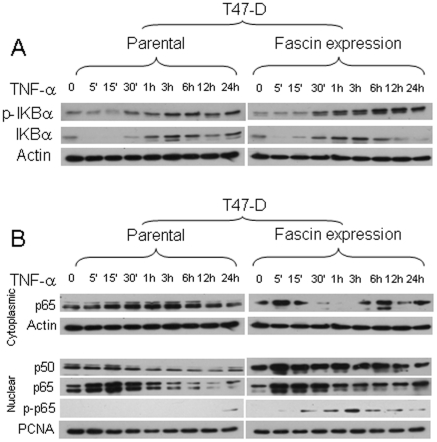
The actin-bundling protein, fascin, is a member of the cytoskeletal protein family that has restricted expression in specialized normal cells. However, many studies have reported the induction of this protein in various transformed cells including breast cancer cells. While the role of fascin in the regulation of breast cancer cell migration has been previously shown, the underlying molecular mechanism remained poorly defined. We have used variety of immunological and functional assays to study whether fascin regulates breast cancer metastasis-associated molecules. In this report we found a direct relationship between fascin expression in breast cancer patients and; metastasis and shorter disease-free survival. Most importantly, in vitro interference with fascin expression by loss or gain of function demonstrates a central role for this protein in regulating the cell morphology, migration and invasion potential. Our results show that fascin regulation of invasion is mediated via modulating several metastasis-associated genes. We show for the first time that fascin down-regulates the expression and nuclear translocation of a key metastasis suppressor protein known as breast cancer metastasis suppressor-1 (BRMS1). In addition, fascin up-regulates NF-kappa B activity, which is essential for metastasis. Importantly, fascin up-regulates other proteins that are known to be critical for the execution of metastasis such as urokinase-type plasminogen activator (uPA) and the matrix metalloproteases (MMP)-2 and MMP-9. This study demonstrates that fascin expression in breast cancer cells establishes a gene expression profile consistent with metastatic tumors and offers a potential therapeutic intervention in metastatic breast cancer treatment through fascin targeting.


Conflict of interest statement

Competing Interests: The authors have declared that no competing interests exist.

Figures

Figure 1
Figure 1. Fascin is associated with disease-free survival in human breast cancer samples.
Survival with or without the disease was reported by oncologist and blotted in relation to fascin expression. Survival curves showing decreased disease-free (A) or overall (B) survival in patients that have fascin positive tumor.
Figure 2
Figure 2. Fascin knockdown alters cell morphology and reduces cell migration.
MDA-MB-231 cells were treated with control (SiCon) or Fascin (SiFascin) SiRNA for 72 hours. A) Cells were then collected and stained for fascin before detection by flow cytometry. B) Top: Immunohistochemistry showing cell morphology and fascin expression after treatment with SiCon or SiFascin in 8-well chamber. Bottom: Immunoflorescent staining showing the altered morphology and distribution of F-actin (red) in cells after treatment with SiFascin in 8-well chamber. Blue color indicates nuclear stain (Dabi). C) Bar graph showing reduced migration in fascin knockdown MDA-MB-231 cells. Data was normalized to SiCon cells and the relative migration is expressed as mean ± SD of triplicate experiments. D) Bar graph showing enhanced cell migration in MDA-MB-231 cells that over-express wild type (WT) fascin compared with mutant (M) over-expressing cells. Data was normalized to parental MDA-MB-231 and the relative migration is expressed as mean ± SD of triplicate experiments.
Figure 3
Figure 3. Fascin regulates breast cancer cell invasion.
A) Bar graph showing inhibition of MDA-MB-231 cell invasion after pretreatment with 20 µM of Cytochalsin D (Cyt D) for 30 minutes prior to the assay. Data was normalized to untreated cells and the relative invasion is expressed as mean ± SD of triplicate experiments. B) Bar graph showing inhibition of MDA-MB-231 cell invasion after fascin knockdown with SiRNA. Data was normalized to con SiRNA cells and the relative invasion is expressed as mean ± SD of triplicate experiments. C) Bar graph showing enhanced cell invasion in MDA-MB-231 cells that over-express WT fascin. Data was normalized to parental MDA-MB-231 and the relative invasion is expressed as mean ± SD of triplicate experiments.
Figure 4
Figure 4. Fascin inhibits nuclear expression of BRMS1 in breast cancer cells.
A) Bar graph showing the relative RNA expression as assessed by real time PCR. Fascin RNA was inhibited, while BRMS1 RNA was enhanced after fascin knockdown. B) Western blot showing enhanced BRMS1 protein expression when fascin was knockdown (Left) and BRMS1 inhibition when WT fascin was over-expressed (Right). C) Right; Representative photograph showing induction of BRMS1 expression in the nucleus after fascin knockdown. Left; Bar graph showing the mean intensity of BRMS1 expression in the nucleus after fascin knockdown as assessed on more than 100 cells per group using attovision software on Pathway 855 from BD. D) Paraffin-embedded sections from breast cancer patients were stained for fascin and BRMS1 and the expression profile and staining intensity were assessed by pathologist. Left: representative image showing strong BRMS1 nuclear staining (Brown) and weakfascin cytoplasmic staining (red). Right: representative image showing weak BRMS1 nuclear staining (Brown) and strong fascin cytoplasmic staining (red). E) Bar graph showing reduced levels of fascin in patients that express high level (≥50 positive with +3 intensity) nuclear BRMS1.
Figure 5
Figure 5. Fascin enhanced uPA, MMP-2 and MMP-9 expression.
A) Western blot showing increased expression of uPA in MDA-MB-231 cells over-expressing WT fascin compared with the mutant over-expressing cells. B) Bar graph showing reduced invasion of SiCon-treated cells when MMP-2/MMP-9 inhibitor II (20 µM) was used. Data was normalized to untreated SiCon cells and the relative invasion is expressed as mean ± SD of triplicate experiments. C) Bar graph showing reduced RNA expression of uPA in fascin knockdown cells as assessed by real time PCR. D) Western blot showing reduced uPA (top) or MMP-9 (bottom) secretion in supernatants of fascin-knockdown cells. E) MMP-2 gelatinolytic activity showing reduced enzymatic activity of secreted MMP-2 in the supernatants of fascin-knockdown cells.
Figure 6
Figure 6. Fascin enhanced NF-κ -dependent transcriptional activity.
A) Bar graph showing inhibition of MDA-MB-231 cell invasion that were treated with NF-κB inhibitor. Data was normalized to untreated cells and the relative invasion is expressed as mean ± SD of triplicate experiments. B) ShCon or ShFascin MDA-MB-231 cells were co-transfected with the NF-κB luciferase promoter and Renilla promoter as in methods. Cells were stimulated with or without (20 ng/ml) TNF-α and luciferase activity was assessed as in methods. C) MDA-MB-231 parental or cells that over-express WT or mutant fascin were co-transfected with the NF-κB luciferase promoter and Renilla promoter as in methods. Cells were stimulated with or without (20 ng/ml) TNF-α and luciferase activity was assessed as in methods.
Figure 7
Figure 7. Fascin enhanced NF-κB nuclear translocation in MDA-MB-231.
A) Western blot showing reduced phosphorylation of IKBα in response to TNF-α stimulation in fascin knockdown cells. B and C) Bar graph showing quantitation of total and phosphorylated IKBα in ShCon and ShFascin cells after stimulation with TNF-α for the indicated time. Results showed the mean of triplicate experiments after normalization to actin and each time point is normalized to 0 time. D) Western blot showing reduced nuclear translocation and phosphorylation of p65 in response to TNF-α stimulation in Fascin knockdown cells. E-G) Bar graph showing quantitation of nuclear P50 and P65 and phosphorylated P65 in ShCon and ShFascin cells after stimulation with TNF-α for the indicated time. Results showed the mean of triplicate experiments after normalization to PCNA and each time point is normalized to 0 time.
Figure 8
Figure 8. Fascin enhanced NF-κB nuclear translocation in T47-D.
A) Western blot showing enhanced phosphorylation of IKBα in response to TNF-α stimulation in fascin-expressing T47-D cells. B) Western blot showing enhanced nuclear translocation and phosphorylation of p65 in response to TNF-α stimulation in fascin-expressing T47-D cells.

Similar articles

Cited by

References

    1. Bashyam MD. Understanding cancer metastasis: an urgent need for using differential gene expression analysis. Cancer. 2002;94:1821–1829. - PubMed
    1. Chambers AF, Naumov GN, Varghese HJ, Nadkarni KV, MacDonald IC, et al. Critical steps in hematogenous metastasis: an overview. Surg Oncol Clin N Am. 2001;10:243–255, vii. - PubMed
    1. Fidler IJ. Seed and soil revisited: contribution of the organ microenvironment to cancer metastasis. Surg Oncol Clin N Am. 2001;10:257–269. vii-viiii. - PubMed
    1. Nicolson GL. Organ specificity of tumor metastasis: role of preferential adhesion, invasion and growth of malignant cells at specific secondary sites. Cancer Metastasis Rev. 1988;7:143–188. - PubMed
    1. Saaristo A, Karpanen T, Alitalo K. Mechanisms of angiogenesis and their use in the inhibition of tumor growth and metastasis. Oncogene. 2000;19:6122–6129. - PubMed

Publication types

MeSH terms